Tag Archives: andrews federal credit union

HBCU Money’s 2025 African American Owned Credit Union Directory

African American-owned credit unions hold more than $8.15 billion in assets and serve 726,929 members in 2025, more than doubling their asset base from $3.81 billion in 2016. That growth confirms that Black-owned cooperative finance remains a living, expanding sector — not a historical artifact. Yet placed against the broader credit union landscape, the numbers tell a more sobering story. The federally insured credit union system holds $2.37 trillion in total assets across 4,411 institutions. African American-owned credit unions, with 205 active institutions down from 318 in 2016, control just 0.34 percent of that total asset base. The sector’s 453 Minority Depository Institution-designated peers collectively hold $95.1 billion in assets; African American institutions account for less than 9 percent of that figure. The gap is not closing fast enough.

The structural challenges are as significant as the asset gap. The median African American-owned credit union holds approximately $2.47 million in assets and serves roughly 618 members placing it squarely in the asset tier where the national system is contracting most aggressively, with institutions under $10 million posting declines in assets, membership, and net worth year over year. Only 40 percent of these institutions maintain an active public website, rendering the majority functionally invisible to younger and mobile-first members. An estimated 30 percent are affiliated with religious congregations, compared to approximately 5 percent of all U.S. credit unions, introducing succession and governance risks that extend well beyond normal institutional turnover. Meanwhile, the HBCU-based credit union subsector has seen five of its eleven institutions close or be absorbed since 2020, leaving six survivors holding a combined $76.8 million in assets — institutions that represent the most direct expression of university-anchored Black financial infrastructure and are quietly disappearing without coordinated intervention.

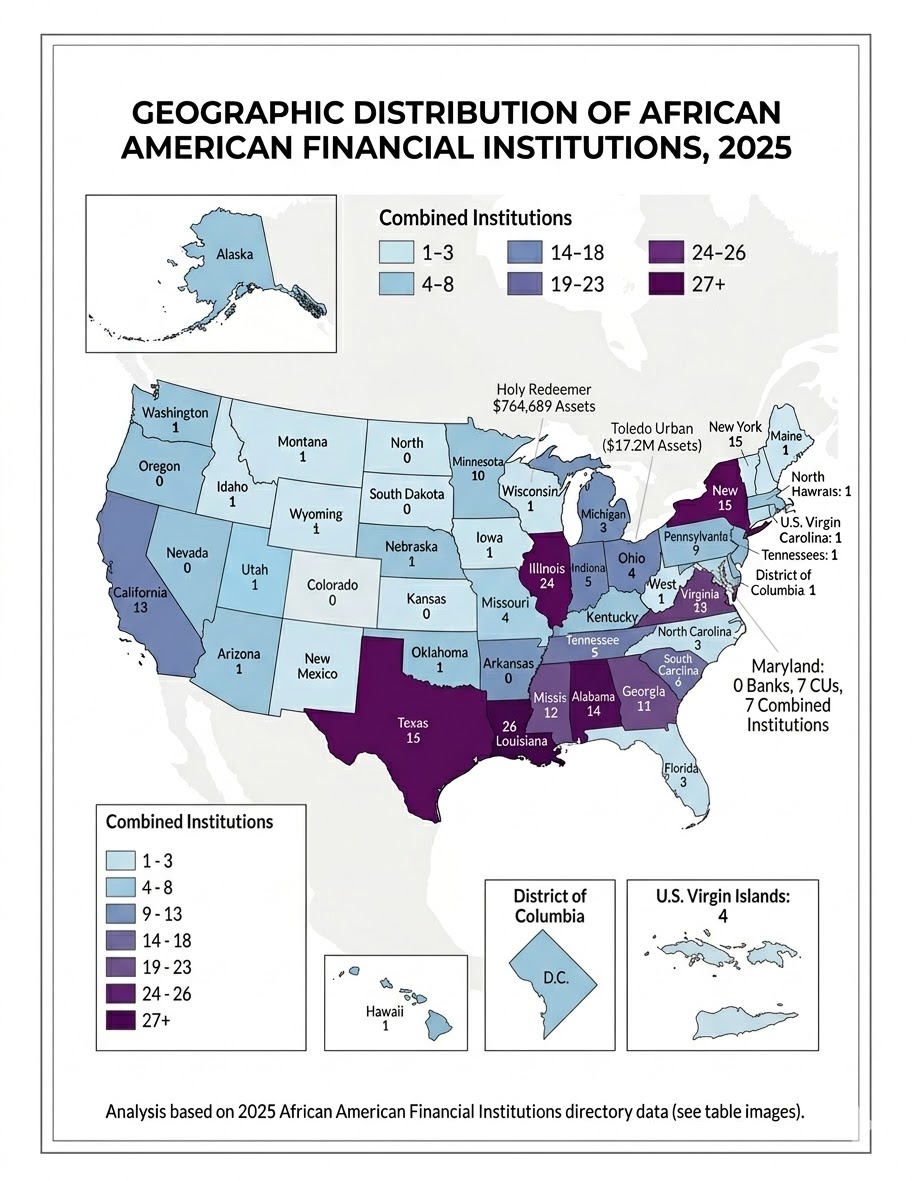
The sector’s geographic concentration compounds these institutional vulnerabilities. Maryland, Mississippi, Missouri, and Virginia together account for roughly 80 percent of all African American-owned credit union assets nationally, while states like California, Minnesota, and Wisconsin maintain only token institutional presences despite substantial African American populations. The South remains the geographic and institutional core, with Louisiana’s 25 institutions representing the largest state count and Mississippi’s Hope Credit Union standing as the sector’s clearest model of what scale and institutional commitment can produce. The path forward runs through consolidation where fragmentation cannot be reversed, digital investment where infrastructure is absent, geographic expansion where populations go unserved, and the fuller utilization of federal support mechanisms such as MDI designation, CDFI certification, and NCUA technical assistance that the sector has historically left on the table.


ADDITIONAL NOTES

  • African American-owned credit unions now hold $8.15 billion in total assets across 205 active institutions, representing 0.34 percent of the $2.37 trillion held by all federally insured credit unions nationally.
  • Total assets in the sector have more than doubled since 2016, rising from $3.81 billion — a 114 percent increase — while membership grew 39.5 percent from 521,078 to 726,929 members over the same period.
  • AACUs average assets per institution: approximately $39.8 million. AACUs median assets per institution: approximately $2.47 million. The gap between the mean and median reflects a sector dominated at the top by a small number of large institutions while the majority operate at a scale that limits their competitive viability.
  • AACUs average members per institution: approximately 3,546. AACUs median members per institution: approximately 618.
  • Only 40 percent of African American-owned credit unions maintain an active public website, representing a critical digital infrastructure deficit in an era of mobile-first financial services.
  • An estimated 30 percent of African American-owned credit unions are affiliated with religious congregations compared to approximately 5 percent of all U.S. credit unions introducing institutional succession risk as American religious participation continues its long-term demographic decline.
  • Louisiana has the largest number of active African American-owned credit union institutions (25), followed by Illinois (23), New York (15), Texas (14), Virginia (13), and Alabama and the District of Columbia with 12 and 10 respectively. Maryland leads all states in total sector assets at $4.47 billion, followed by Mississippi at $1.05 billion and Missouri at $480 million.
  • California — the most populous U.S. state and home to one of the largest African American populations in the country — has a single active African American-owned credit union with $318,105 in assets and 262 members, a presence that has contracted since 2016.
  • The sector’s credit union count has declined from 318 institutions in 2016 to 205 active institutions in 2025, a reduction of 35 percent, driven primarily by closures, mergers into non-Black institutions, and voluntary dissolutions.
  • For comparison, the national credit union system added 2.9 million members over the past year alone, reaching 143.2 million total members — nearly 200 times the total membership of all African American-owned credit unions combined.

Complete Directory

African American Owned Credit Unions by State:

Alabama


Arkansas


California


Connecticut


Delaware


District of Columbia


Florida


Georgia


Illinois


Indiana


Louisiana


Maryland


Michigan


Minnesota


Mississippi


Missouri


New Jersey


New York


North Carolina


Ohio


Oklahoma


Pennsylvania


South Carolina


Tennessee


Texas


Virgin Islands


Virginia


West Virginia


Wisconsin


Source: NCUA

Mapping the Gap: The Geography of African American Banks and Credit Unions in 2025

African Americans navigating their financial lives are operating inside two fundamentally different types of institutions, and understanding that difference is not academic it is strategic. JPMorgan Chase, the largest bank in the United States with over $3.9 trillion in assets, is a publicly traded corporation owned by shareholders. Its mandate is profit. It can accept corporate deposits, underwrite municipal bonds, finance international trade, issue letters of credit that move goods across oceans, syndicate billion-dollar loans, and operate in 100 countries. When a city government needs to finance a new highway, when a developer needs to close on a $200 million mixed-use project, when a corporation needs to hedge currency risk across three continents — JPMorgan is in that room. Navy Federal Credit Union, the largest credit union in the United States with approximately $180 billion in assets, is a member-owned cooperative. Its mandate is service to its members, who must meet eligibility requirements tied to military affiliation. It offers mortgages, car loans, checking accounts, and credit cards often at better rates and lower fees than JPMorgan but it cannot write a commercial real estate construction loan for a developer, cannot underwrite a municipal bond for a city, cannot finance an export contract for a manufacturer shipping goods to West Africa, and has no presence in international capital markets. Navy Federal is a powerful institution for what it does. It simply does not do what JPMorgan does, and JPMorgan does not do what Navy Federal does at the community level. For African Americans, this distinction carries enormous consequence. A community with only credit unions has access to consumer financial products; mortgages, auto loans, personal savings but lacks the commercial banking infrastructure needed to finance business growth, real estate development, institutional deposits, and economic expansion. A community with only banks, and specifically only large national banks with no cultural accountability, has access to products but not necessarily to equitable underwriting, community reinvestment, or the trust that comes from shared ownership. The absence of an African American-owned bank in Ohio or Wisconsin is not just symbolic. It means no institution with a community mandate is positioned to finance the next African American developer, fund the next HBCU-adjacent business corridor, or serve as a depository for the growing institutional wealth of Black organizations in those states.

When the geography of African American banks and credit unions is examined together, a more complete — though still incomplete — picture of Black financial infrastructure emerges across the United States. The 2025 African American Owned Bank Directory covers 17 institutions across 15 states and territories. The 2025 NCUA data on African American credit unions adds 205 institutions across 29 states and territories, carrying $8.15 billion in assets and serving approximately 727,000 members. Combined, the two sectors represent over 220 institutions and more than $14.8 billion in assets operating across 31 states and territories. But geography, not just totals, is where the real story lives.

Thirteen states have both an African American-owned bank and at least one African American credit union: Alabama, the District of Columbia, Georgia, Illinois, Louisiana, Michigan, Mississippi, North Carolina, Oklahoma, Pennsylvania, South Carolina, Tennessee, and Texas. These are the states with the fullest financial ecosystem — where a community member can choose between a bank product and a credit union product from an institution with cultural roots in their community. Louisiana stands out, with one bank and 25 credit unions, the most of any state in the credit union count. Illinois follows with one bank and 23 credit unions.

Two states have African American banks but no African American credit unions in the NCUA data: Massachusetts, home to OneUnited Bank, and Utah, newly represented by Redemption Bank. These institutions serve their communities without the complementary infrastructure of a credit union network. Conversely, 16 states and territories have African American credit unions but no African American-owned bank: Arkansas, California, Connecticut, Delaware, Florida, Indiana, Maryland, Minnesota, Missouri, New Jersey, New York, Ohio, Virginia, the U.S. Virgin Islands, West Virginia, and Wisconsin.

The cases of Ohio and Wisconsin, discussed at length in the bank directory analysis, illustrate the limits of credit union coverage as a substitute for bank presence. Ohio has four African American credit unions with combined assets of approximately $18.3 million: Mahoning Valley in Youngstown, Mt. Zion Woodlawn in Cincinnati, Cleveland Church of Christ in Cleveland, and Toledo Urban in Toledo. Of these, Toledo Urban is the only institution of meaningful scale at $17.2 million in assets with 4,324 members. The other three are micro-institutions, each under $600,000 in assets and under 400 members. Wisconsin’s single credit union, Holy Redeemer Community of SE Wisconsin based in Milwaukee, holds just $764,689 in assets and serves 239 members. For a city where African Americans comprise roughly 39 percent of the population, that represents an institutional void that one small credit union cannot fill. Neither Ohio nor Wisconsin has an African American financial institution capable of writing a commercial real estate loan, funding a startup, or underwriting a mortgage for a first-generation homebuyer at any meaningful scale.

African American Financial Institutions by State, 2025

StateAfrican American BanksAfrican American Credit UnionsCombined Institutions
Alabama21214
Arkansas033
California011
Connecticut033
Delaware011
District of Columbia11011
Florida033
Georgia2911
Illinois12324
Indiana055
Louisiana12526
Maryland077
Massachusetts101
Michigan145
Minnesota022
Mississippi11112
Missouri044
New Jersey099
New York01515
North Carolina123
Ohio044
Oklahoma112
Pennsylvania189
South Carolina156
Tennessee156
Texas11415
Utah101
U.S. Virgin Islands044
Virginia01313
West Virginia011
Wisconsin011

Maryland presents a striking and instructive contrast. It has no African American-owned bank, a gap noted in the 2025 directory, yet it is the single largest state for African American credit union assets, hosting seven institutions with a combined $4.47 billion in assets. That figure is driven primarily by two institutions: Andrews Federal Credit Union in Suitland with $2.47 billion in assets and 142,076 members, and Municipal Employees Credit Union of Baltimore with $1.26 billion in assets and 98,358 members. Maryland’s credit union sector is, in asset terms, larger than the entire African American bank sector nationally. This is remarkable. It is also a reminder that credit unions and banks occupy different structural roles. Andrews Federal and MECU of Baltimore are large, sophisticated institutions with product offerings that approach commercial banking but they are member cooperatives, not banks, and their ownership structure, regulatory environment, and community lending mandates differ accordingly. Maryland’s absence from the bank directory is still a gap worth addressing, even with $4.47 billion in credit union assets in the state.

Virginia and Missouri follow a similar pattern to Maryland, albeit at smaller scale. Virginia has 13 African American credit unions with $471 million in assets but no African American-owned bank. Missouri has four credit unions with $481 million in assets, anchored by St. Louis Community Credit Union at $431.5 million, and also no bank. New York has 15 credit unions with $76 million in assets and no African American bank, a particularly stark figure given the size of New York’s African American population and its status as the financial capital of the country.

The states that are entirely absent from both the bank and credit union directories deserve attention. While the combined coverage of 31 states and territories is broader than either sector alone, large portions of the country remain without any African American-owned financial institution. States like Nevada, Arizona, Colorado, Washington, Oregon, and much of the Mountain West and Pacific Northwest have no representation in either directory. As African Americans continue to migrate to new metros — Las Vegas, Phoenix, Denver, Seattle — the absence of community-controlled financial institutions in those corridors becomes a growing concern.

The combined picture is this: African American banks and credit unions together hold approximately $14.8 billion in assets, serve over 700,000 credit union members and the deposit base of 17 banks, and operate across 31 states and territories. The credit union sector, at $8.15 billion in assets across 205 institutions, is actually slightly larger than the bank sector’s $6.72 billion across 17 institutions, a reflection of the credit union model’s greater accessibility and the longer runway some of these institutions have had to grow. But the two sectors are not interchangeable. Banks can hold commercial deposits, write business loans, issue letters of credit, and serve as the financial backbone of an entrepreneurial ecosystem in ways that most credit unions cannot. Credit unions, in turn, offer member ownership, lower fees, and community accountability that publicly or privately held banks may not. The African American community needs both, in every state where its population is substantial. Right now, it has neither in too many places that matter.

Sources: HBCU Money 2025 African American Owned Bank Directory; 2025 NCUA African American Credit Union Institutions data. Asset figures in U.S. dollars.

Disclaimer: This article was assisted by Claude (Anthropic).