Our work is the presentatoin of our capabilities. – Edward Gibbon
There is an old story about a village that lived along a great river. Every season, merchants from distant lands traveled that river, loading their boats with timber, ore, and grain pulled from the very land the villagers had worked for generations. Those merchants sailed downstream to markets where fortunes were made and power was consolidated, and season by season, neighboring tribes who had learned to build boats and send their own goods to market grew stronger their granaries fuller, their children better protected, their voices louder in the councils where decisions were made about who owned what and who owed whom. The village elders watched all of this from the bank. They were not ignorant men and women. They knew the river better than any merchant who passed through. They understood its currents, its seasons, its dangers. But they had never built boats. The lumber was expensive. The tools were hard to come by. The timing was never quite right. And so the resources of their land flowed downstream in other people’s vessels, enriching other people’s villages, while their own families and sibling villages just around the bend, bound to them by blood and history grew more exposed with each passing year. Then one season, a young man and a young woman stood before the elders and said: we know how to build the boats. We know where the timber is. We know the market downstream. The only question is whether this village will finally decide that the river belongs to us too.
The most consequential capital markets event in African history is unfolding in real time, and there is no reason for HBCU endowments and alumni associations to be spectators.
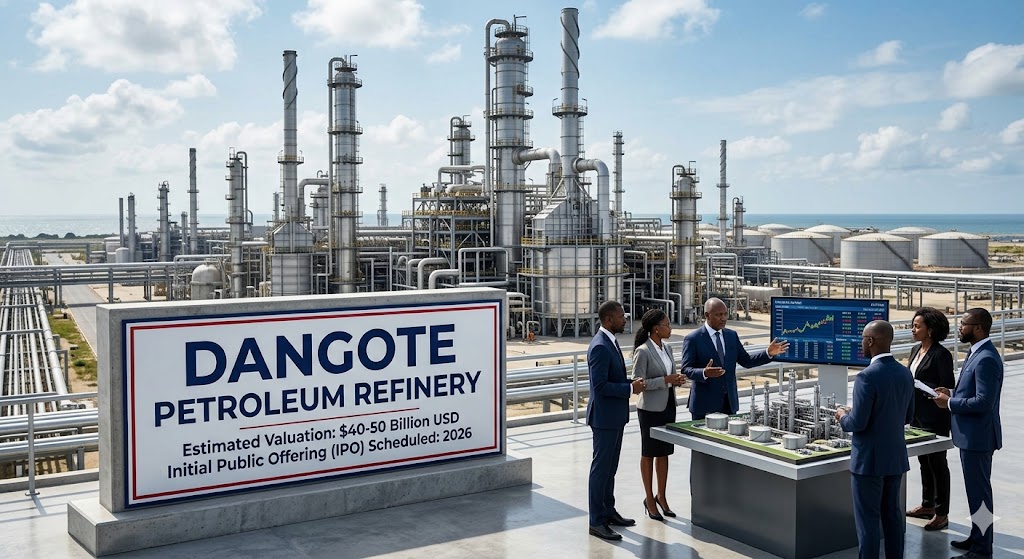
Aliko Dangote, the Nigerian industrialist whose Dangote Petroleum Refinery and Petrochemicals FZE has already reshaped the energy economics of West Africa, is preparing to take the refinery public. The offering structured as a coordinated multi-exchange IPO spanning the Nigerian Exchange, the Johannesburg Stock Exchange, the Nairobi Securities Exchange, the Ghana Stock Exchange, and several additional African bourses carries a valuation range of $40 billion to $50 billion. At a 10% stake offering, the actual transaction size approaches $5 billion, making it by a wide margin the largest equity offering ever conducted on an African stock exchange. The IPO subscription window is expected to open later in 2026.
For HBCU endowment officers, foundation boards, and alumni association investment committees who have spent the last decade searching for alternative assets that offer both competitive returns and meaningful institutional alignment, this transaction deserves serious analysis. It is not a charity play or a symbolic gesture toward Pan-African solidarity. It is a hard industrial asset, generating real revenue in hard currency, operating at the center of a continental energy transformation that will define the next quarter century of African economic development.
The strategic case begins with the asset itself.
The Dangote Refinery, located in the Ibeju-Lekki Free Trade Zone on the outskirts of Lagos, is the world’s largest single-train crude oil processing facility, with a current capacity of 650,000 barrels per day. It reached full operational capacity in early 2024, has already turned Nigeria into a net fuel exporter, and has disrupted global trade routes that previously ran refined petroleum products from European refineries back into the African market. The refinery currently supplies over 90% of Nigeria’s domestic petrol demand and has exported refined fuel to five African countries. The Dangote Group’s revenues have grown from $3.3 billion to $18 billion over the past five years, and the refinery’s expansion roadmap which envisions more than doubling capacity to 1.4 million barrels per day is the central purpose of the IPO capital raise.
One structural feature of the transaction is particularly noteworthy for institutional investors operating in the United States: dividends will be paid in US dollars, even though shares are purchased in naira. This is not a minor administrative detail. It addresses the core foreign-exchange risk concern that typically limits American institutional appetite for African equity markets. Dollar-denominated dividends from an asset generating dollar-denominated revenues — the refinery sells its output at global commodity prices — transforms the currency risk profile of the investment from speculative to manageable. For HBCU endowments that are overwhelmingly concentrated in US equities and fixed income, this creates a genuine entry point into the African investment universe without the full currency risk exposure that has historically made direct African market participation unattractive.
Now consider where HBCU endowments currently stand in the landscape of American higher education finance.
According to the most recent NACUBO-Commonfund Study of Endowments, HBCU institutions accounted for approximately $2.4 billion of the $944 billion in total endowment assets reported by participating institutions. The average HBCU endowment was $236.7 million, compared to $1.4 billion for all NCSE respondents. Only two HBCUs — Howard University, which crossed the $1 billion threshold, and Spelman College hold endowments above $500 million. The PWI-to-HBCU endowment gap among the top 10 institutions in each category stands at roughly 129 to 1. HBCU endowment gift flows fell to $67.7 million in FY25 from $91.9 million in FY24. On nearly every metric, the structural undercapitalization of HBCU institutional wealth is not merely significant; it is a threat to the long-term viability of institutions that serve as the backbone of African American professional formation.
The investment allocation patterns compounding this problem are equally stark. HBCU endowments allocate just 14% of their portfolios to alternative asset classes, compared to 41% for their non-HBCU peers — a 27-percentage-point gap that systematically excludes them from the asset classes driving the highest long-term returns. The reasons are structural and understandable: smaller endowments have fewer investment staff, face higher minimum investment thresholds at most alternative asset managers, and operate with more conservative board mandates. But the consequence is that HBCU endowments are systematically excluded from the alternative and international asset classes that generate the outsized returns sustaining the endowments of Harvard, Yale, and the University of Texas system. The compounding effect of this exclusion over decades is not a gap — it is a chasm.
The Dangote IPO, precisely because of its scale, its multi-exchange structure, and its dollar dividend commitment, represents an unusual opportunity to begin addressing one dimension of this allocation problem.
For institutions with sufficient endowment size to participate as institutional investors in the international tranche of the offering — Howard, Spelman, Hampton, and a small handful of others — the case for direct participation is straightforward. A position in the world’s largest single-train refinery, at an entry valuation of $40 to $50 billion, in an asset whose expansion is already funded and whose revenues are denominated in the currency in which your dividends will be paid, provides genuine portfolio diversification, inflation protection through commodity-linked revenues, and exposure to the fastest-urbanizing, fastest-growing consumer energy market on earth. Africa’s urban population is projected to double by 2050. Every major city added to the African urban grid requires energy infrastructure. The Dangote Refinery is positioned at the center of that demand trajectory.
For institutions whose endowment size makes direct participation in the IPO difficult which is the reality for most of the HBCU sector the answer is not to sit out. It is to aggregate. The 1890 Foundation, which serves as the coordinating hub for the nation’s 19 historically Black land-grant universities and has already demonstrated its capacity to administer large-scale federal partnerships, is the most credible existing infrastructure for a consortium investment vehicle among its member institutions. A formally structured investment fund operating through the 1890 network governed by participating endowment officers, managed by professional advisers with international markets experience, and capitalized through pooled contributions from member institutions would provide access to investment minimums and due diligence resources that no individual 1890 institution could assemble independently. The SWAC, MEAC, SIAC, CIAA, and HBCU Athletic Conference represent analogous organizing structures across the sector where the same consortium investment logic applies where each already functions as a governance body with member institutions, shared administrative infrastructure, and collective standing that could anchor a pooled investment vehicle.
HBCU alumni associations belong in this conversation, but not as secondary vehicles for the institution’s benefit. They belong as independent institutional investors making strategic decisions on their own financial merits. An alumni association that builds an investment fund with its own governance, its own professional management, and its own return targets is building institutional wealth for its membership, not running a philanthropic pipeline to its parent institution. The distinction matters. An alumni association investment fund capitalized by members seeking competitive financial returns will attract a different level of participation, a different quality of governance, and ultimately a different scale of capital than one framed as an alumni giving mechanism wearing investment clothes. Where coordination between a university endowment and its alumni association investment fund makes strategic sense such as co-investment in a shared opportunity, shared due diligence costs, complementary positions in the same offering that coordination should happen by design, not by default. But each institution must be making an independent decision of financial merit.
The argument for this model is not merely aspirational. It has historical precedent in other diaspora investment networks. The Indian American diaspora has consistently channeled capital into Indian infrastructure and technology sectors through organized networks of high-net-worth investors coordinated through professional associations and regional affinity groups. Cuban American capital networks have played a documented role in channeling investment back into businesses serving the diaspora in South Florida. Jewish American institutional networks have sustained diaspora bond programs through organized professional and philanthropic structures for decades. The mechanisms are known. The question is whether African American institutional leadership will build the organizational infrastructure to replicate them.
But the case for HBCU institutional participation in the Dangote IPO extends beyond portfolio diversification or even diaspora solidarity. It is about the connective tissue between two halves of the same people that has never been fully built. African American institutions sit on intellectual capital in agriculture, medicine, engineering, law, public policy, and the sciences that is directly relevant to the development challenges facing African Core nations. African institutions sit on natural capital, emerging market infrastructure, and a demographic growth trajectory that represents the most significant economic expansion of the twenty-first century. The relationship between the two has been episodic and philanthropic where it should be structural and transactional. An HBCU endowment that holds equity in the Dangote Refinery is not making a charitable gesture toward the continent — it is establishing a financial relationship that creates the institutional logic for research partnerships, faculty exchanges, student pipelines, and joint ventures that philanthropy alone never compels. Capital is the language institutions speak to each other when they intend to be taken seriously. Beyond the bilateral opportunity, there is a harder truth: Africa’s resources have been extracted, its assets undervalued, and its markets structured to serve outside interests since the colonial era. That dynamic does not end on its own. It ends when African institutions and their diaspora counterparts accumulate enough ownership stake in African Core assets that the continent’s wealth begins compounding inward rather than flowing out. Every dollar of HBCU and African American institutional capital deployed into African equity markets is a dollar that does not go to the outside investors who have historically treated the African Core as a source of raw return without reciprocal obligation. Ownership is the only permanent answer to extraction.
The Dangote IPO is not only an investment proposition. It is a test of whether Black institutional America can organize itself to participate in the capital formation of the African Core, the region whose industrialization will define the global economy’s next chapter or whether, once again, the value created in this geography will accrue primarily to investors who had the institutional organization to show up.
Nigeria’s regulatory environment carries the political and macroeconomic variance typical of any large, resource-rich emerging economy no more inherently unstable than the frontier and emerging markets of Eastern Europe, Southeast Asia, or Latin America that well-capitalized endowments have allocated to for decades without treating the risk as exceptional. That Nigerian markets have historically been characterized as uniquely risky reflects less about Nigeria’s actual risk profile than about the systematic undervaluation of African Core economies by external rating frameworks designed to serve the capital interests of institutions that benefit from keeping African assets mispriced. The multi-exchange listing structure presents a genuine operational challenge: coordinating clearing, settlement, and trading standards across multiple African exchanges simultaneously has no established precedent at this scale, and execution risk is real. Currency risk, while substantially mitigated by the dollar dividend structure, is not eliminated. And the refinery carries $3.65 billion in outstanding debt, with plans to repay through operations and asset sales — a material factor in any serious valuation analysis.
These risks are real. They do not, however, distinguish this offering from the risk profile of the emerging market private equity and infrastructure funds that well-capitalized non-HBCU endowments have been allocating to for the past two decades. The difference is not that those endowments found risk-free investments in emerging markets. The difference is that they built the institutional capacity to analyze and manage those risks, and they positioned themselves to capture the returns that came with accepting them.
HBCU endowments that remain concentrated in domestic equities and fixed income because they lack the investment staff to evaluate an African infrastructure IPO are not being prudent. They are being institutionally underpowered in a way that will compound against their beneficiaries for generations.
The path forward requires several concrete steps. First, HBCU endowment boards and foundation leadership should commission formal analysis of the Dangote prospectus as it becomes available and engage the offering’s appointed advisers — Stanbic IBTC Capital, Vetiva Advisory Services, and FirstCap — to understand the terms available to international institutional participants. Second, the 1890 Foundation, UNCF, the Thurgood Marshall College Fund, the HBCU Faculty Development Network, and the leadership of the SWAC, MEAC, SIAC, CIAA, and HBCU Athletic Conference should open formal conversations now about the governance structure of consortium investment vehicles within their respective networks, before this offering closes and before the next one arrives. Each of these organizations already operates across multiple institutions with shared administrative infrastructure; the investment coordination function is an extension of capacity they already possess, not a capability they would need to build from scratch. Third, HBCU alumni association leadership (national organizations, alumni chapters, and the professional networks that shadow every major HBCU) should be building investment fund infrastructure as a parallel track, governed independently and capitalized on financial merit, with coordination with institutional endowments happening where it creates genuine value for both parties.
The architecture of African wealth is being redrawn. The Dangote IPO is not a metaphor for that process. It is the process, in concrete form, open for institutional participation by any investor with the organizational capacity to engage it.
The young man and the young woman are standing before the elders. The boats can be built. The only question is whether this village will finally decide that the river belongs to them too.
This article is for informational and analytical purposes only and does not constitute investment advice. Prospective investors should conduct independent due diligence and consult qualified financial advisers before making investment decisions.
Disclaimer: This article was assisted by ClaudeAI.