Note: These data are based on colleges, universities, affiliated foundations, and related nonprofit organizations that volunteered to participate in NACUBO’s endowment study series.
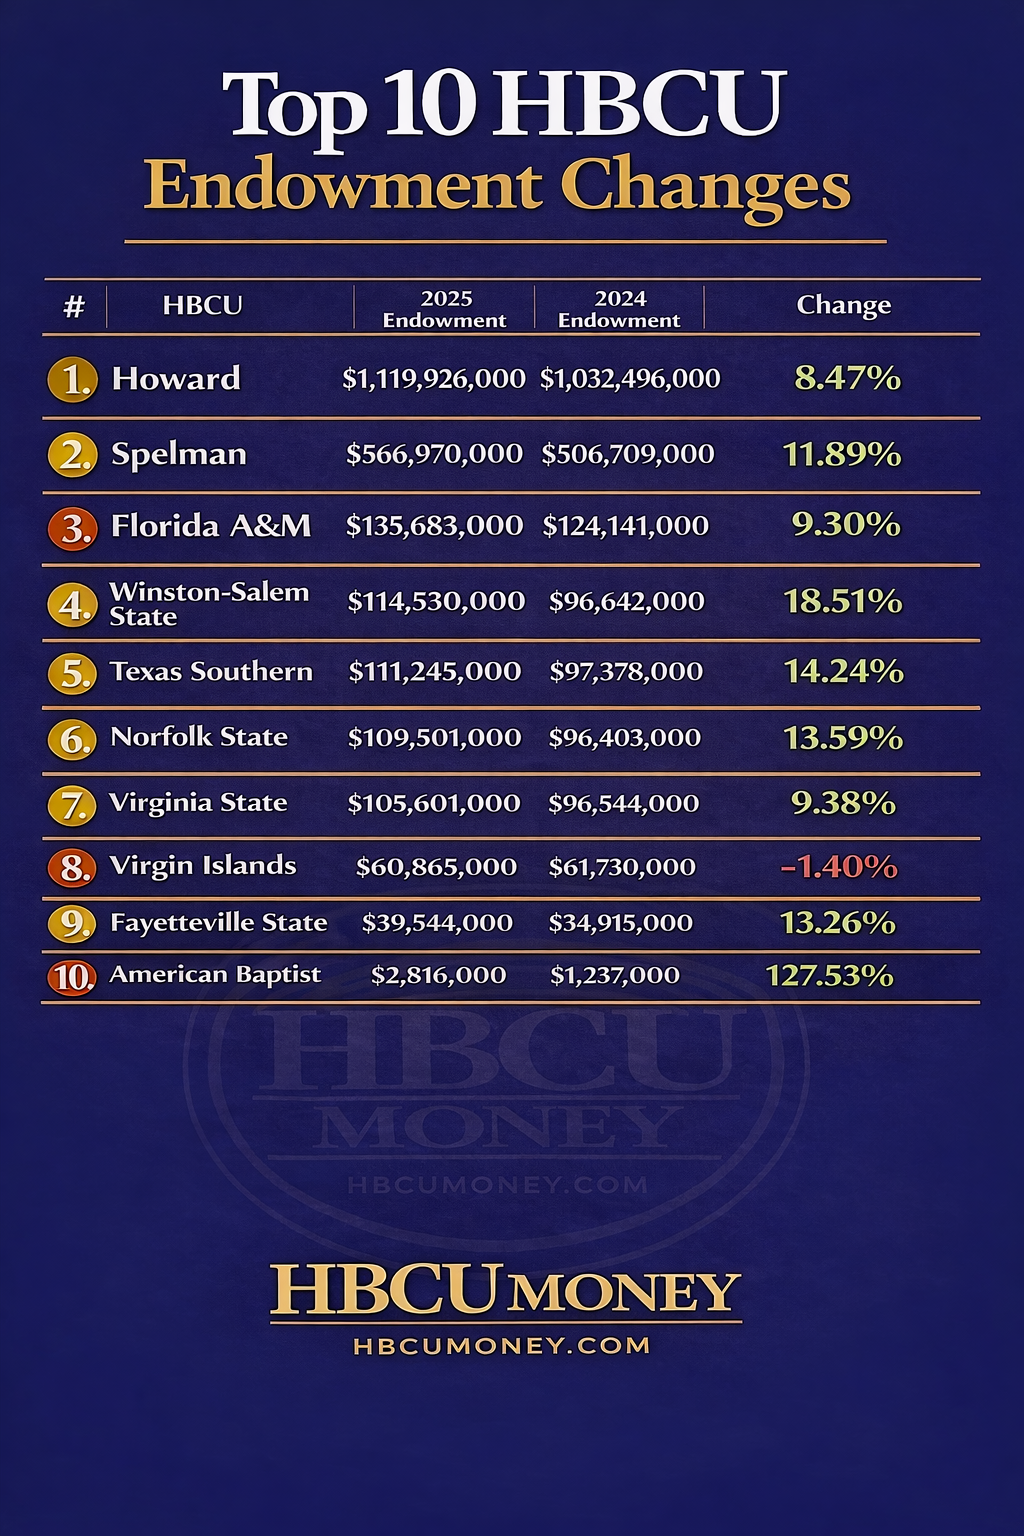
A year after Howard University became the first HBCU to break the $1 billion endowment value mark, four other HBCUs have reached the $100 million mark. It is a complicated celebration when the NACUBO report shows 89 PWIs who have at least $2 billion in endowment value. A few notable HBCUs who reported last year like Morehouse College, North Carolina A&T and Meharry Medical College who have been regular NACUBO participants, are all absent from this year’s list. An HBCU favorite, the University of Virgin Islands returned after an absence in 2024. The reality on the ground with the looming crisis in admissions is for most HBCUs, $500 million is the endowment floor and only two HBCUs (Howard and Spelman) are above that mark. With not as many students graduating K-12, that means HBCUs who are heavily reliant on tuition revenue will see acute strains in the coming decade. It is not a matter of if, but when. Strong endowments are often the only thing that can see institutions through times of stress. That currently includes political stress that all colleges and universities are facing as it relates to state and federal funding. The lack of urgency among HBCU alumni continues to be concerning. Many HBCU alumni think their institution is in better financial shape than it is with no real landscape of higher education economics and the factors that create vulnerability. Using HBCU Alumni Associations and Chapters as more aggressive investment vehicles that can benefit an HBCU’s foundation and endowment are paramount to long-term stability. But this means seeing them as more than social clubs. HBCUs like all African American institutions are in perilous times and continued reliance on lottery philanthropy that may or may not come from non-alumni driven philanthropy (see Mackenzie Scott, Michael Bloomberg, etc.) is as dangerous as hoping to pay your bills every month with scratch off lottery tickets.
“This year’s report shows how important well-managed endowments are to colleges and universities,” said Kara D. Freeman, NACUBO President and CEO. “Endowments help fuel innovation and serve as a stable foundation for institutions. Because of challenges in the economy, some institutions relied more heavily on their endowments—but that additional spending benefited students, faculty, staff, research, operations, and more. Endowments make college possible and more affordable, and contribute to better lives for all.”
NACUBO HIGHLIGHTS:
Top 10 HBCU Endowment Total – $2.4 billion*
Top 10 PWI Endowment Total – $340.0 billion
Number of PWIs Above $2 billion – 89
Number of PWIs Above $1 billion – 169
Number of HBCUs Above $1 billion – 1
Number of HBCUs Above $100 million – 4*
678 colleges, universities, and education-related foundations completed NACUBO’s FY25 survey and those institutions hold $953.7 billion of endowment assets with an average endowment of $1.4 billion and median endowment of $259.9 million.
HBCUs comprised 1.4 percent of NACUBO’s reporting institutions and 0.3 percent of the reporting endowment assets.
PWI endowments (32) with endowments over $5 billion hold 57.4 percent of the $953.7 billion in endowment assets.
**The change in market value does NOT represent the rate of return for the institution’s investments. Rather, the change in the market value of an endowment from FY24 to FY25 reflects the net impact of: 1) withdrawals to fund institutional operations and capital expenses; 2) the payment of endowment management and investment fees; 3) additions from donor gifts and other contributions; and 4) investment gains or losses.
SOURCE: NACUBO
Take a look at how an endowment works. Not only scholarships to reduce the student debt burden but research, recruiting talented faculty & students, faculty salaries, and a host of other things can be paid for through a strong endowment. It ultimately is the lifeblood of a college or university to ensure its success generation after generation.
The most difficult thing in life is to know yourself. — Thales
The Graham Principle: Why HBCU Business Schools Must Lead From Within
Warren Buffett’s rejection by Benjamin Graham is more than a quaint footnote in the history of American finance. It is a parable about institutional loyalty, strategic insulation, and the deliberate construction of parallel economic power. Graham, the architect of value investing, declined to hire the future Oracle of Omaha not for lack of qualification but for reasons of principle. At a moment when Wall Street’s doors remained firmly closed to European American Jews, Graham made a conscious decision to build from within his own community. His hiring practices were not sentimental. They were strategic—an act of institutional self-preservation in a market structured against him. He understood that talent required more than identification; it required cultivation, protection, and deliberate positioning within institutions the community itself controlled.
A decade has passed since anyone undertook a comprehensive examination of leadership trends within HBCU business schools. The intervening years might reasonably have produced a renaissance of internal cultivation—an era defined by deliberate succession planning, alumni-led governance, and a clear institutional commitment to developing leadership from within. That hope has gone largely unrealized. Across the landscape of HBCU business education, the preference for external hires persists, the pipeline for internal leadership development remains thin, and the governing logic of these schools continues to defer, implicitly or explicitly, to standards of excellence defined by the very institutions that historically excluded Black scholars from full participation.
The appointment of deans and senior faculty from predominantly white institutions is routinely framed as a commitment to excellence—the familiar rhetoric of meritocracy dressed in the language of best practices. What this framing systematically obscures is the structural disadvantage HBCU graduates face in academic and professional labor markets, disadvantages produced not by deficiency but by decades of underfunding, network exclusion, and credential discrimination. When HBCU business schools accept this framing uncritically, they do not rise above structural inequality; they reproduce it within their own walls. The result is a business education ecosystem that remains institutionally disconnected from the communities it is chartered to serve.
Of the 85 accredited HBCU business schools and departments operating under the latest available data, fewer than 20 percent are led by HBCU alumni. Of that minority, fewer than half hold both undergraduate and graduate degrees from HBCUs, further attenuating the institutional knowledge that might otherwise be reinvested across the ecosystem. The contrast with elite PWI practice is clarifying. Approximately 75 percent of business school deans at Ivy League institutions hold at least one degree from an Ivy League school. This is not coincidence. It reflects a deliberate institutional philosophy that prizes continuity, internal network loyalty, and cultural capital accumulated within the institution itself. These schools understand that leadership is not merely a management function. It is an expression of institutional identity and a mechanism for transmitting values across generations of students and faculty.
HBCU business schools have not absorbed that lesson with equivalent seriousness. The absence of a deliberate succession strategy—one that identifies, mentors, and elevates internal talent over sustained periods—constitutes a structural failure that compounds over time. When young Black scholars do not see themselves reflected in the senior leadership of their own institutions, the implicit signal is that the path to authority runs elsewhere. And so it does. Promising scholars educated at HBCUs routinely migrate to PWIs for higher compensation, greater prestige, or more robust professional infrastructure. When those scholars eventually ascend to positions of institutional leadership, their loyalty and networks do not reliably return. The brain drain becomes self-reinforcing, and the institutions that initially formed these scholars see little of the compounded return on that investment.
This pattern might be called institutional amnesia—a collective failure to study, internalize, and replicate the strategies through which other minority communities have built durable institutional ecosystems. Jewish, Catholic, and Mormon institutions have each constructed powerful networks by systematically aligning leadership selection with community identity, concentrating institutional resources within their own structures, and maintaining cultural continuity across leadership transitions. They benchmark their performance against their own historical trajectories and communal objectives, not against the preferences of institutions oriented toward different communities and different purposes. HBCU business schools, by contrast, frequently evaluate themselves against ranking systems and accreditation frameworks built around metrics that reflect neither their mission nor the specific market failures their students are positioned to address.
The strategic costs of this posture are substantial and compounding. Recruitment searches for business school deans, when conducted through executive search firms, routinely exceed $250,000 in direct expense. When that investment produces a dean with limited institutional loyalty and no deep roots in the community the school serves, the organization is exposed to the further costs of short tenures, strategic discontinuity, and misaligned fundraising. Business schools function as economic engines—engines that generate networks, direct student talent toward particular career paths, shape research agendas, and produce or fail to produce the intellectual infrastructure that sustains community-level economic development. Leadership that lacks genuine cultural and strategic commitment to the HBCU mission cannot be expected to operate that engine in the community’s interest.
The curriculum consequences are equally significant. HBCU business schools exist in a moment when the structural dimensions of Black economic life—persistent wealth gaps, discriminatory access to capital, the collapse of Black-owned financial institutions, the chronic underdevelopment of Black neighborhoods—constitute some of the most pressing and tractable problems in American political economy. Addressing those problems requires not merely academic competence but institutional orientation. Who is designing curricula around cooperative economics and community wealth retention? Who is building research programs on Black entrepreneurship, the historical function of Black banking, and the mechanics of financial exclusion? Who is developing partnerships with Black-owned financial institutions, investment funds, and real estate developers that would allow students to graduate with network capital as well as intellectual credentials? These priorities require leadership that has been formed within the ecosystem, that understands its history, and that has a personal stake in its long-term trajectory.
The Graham analogy holds at precisely this level of analysis. Graham’s decision to hire from within his community was not a concession to sentiment. It was a calculated judgment that institutional effectiveness depended on leadership whose values, networks, and long-term interests were structurally aligned with the institution’s mission. He was not interested in demonstrating that his firm could attract talent validated by mainstream institutions. He was interested in building something that would compound over time within his own community’s orbit. The question for HBCU business school leadership is whether a comparable institutional logic is possible—and whether the will exists to pursue it.
The remedies are neither mysterious nor beyond reach, but they require deliberate institutional action sustained over years rather than episodic declarations of intent. HBCU business schools must establish formal succession pipelines that identify promising alumni early, support their doctoral training and early-career development, and create structured pathways back into institutional leadership. Mentorship programs, leadership fellowships, and transparent internal promotion tracks are the instruments through which this pipeline is built and maintained. Without them, talented HBCU alumni will continue to be absorbed by institutions with superior infrastructure, and the cycle of external dependence will continue.
Boards of trustees and presidential leadership must also reckon honestly with the hiring criteria that have produced current outcomes. Cultural alignment, mission literacy, and demonstrated investment in HBCU communities should carry weight commensurate with academic credentials in dean and faculty searches. These are not competing values. They are complementary ones, and institutions that treat them as such will find that the pool of qualified, mission-aligned candidates is larger than conventional search processes have suggested.
The benchmarks against which HBCU business schools measure their progress require reconstruction as well. Chasing rankings defined by and for PWIs produces strategic mimicry rather than institutional distinctiveness. The appropriate comparators are institutions that have used internal leadership and community alignment to produce durable economic outcomes for the communities they serve. The relevant question is not whether an HBCU business school resembles Wharton. It is whether that school is building the human capital, research infrastructure, and network density that the African American institutional ecosystem requires to become economically self-reinforcing.
Alumni hold a particular form of leverage in this process that has been insufficiently exercised. Philanthropic capital directed toward HBCU business schools carries with it the legitimate expectation of institutional integrity. Alumni who fund these schools are entitled to ask whether the institutions are investing in their own—whether succession planning exists, whether internal candidates are being developed and promoted, whether the school’s research and curricular agenda reflects the community’s strategic needs. These are not hostile demands. They are the expressions of institutional ownership that any serious donor community directs toward the organizations it sustains.
The broader HBCU ecosystem has long understood, at least in principle, that institutional density is the precondition for community resilience. Strong communities are not produced by exceptional individuals operating in isolation. They are produced by networks of reinforcing institutions—universities, banks, hospitals, media organizations, research centers—that retain capital, concentrate talent, and coordinate strategically across organizational boundaries. Business schools are a critical node in that network. They are the institutions most directly positioned to translate academic investment into economic infrastructure, to convert tuition into entrepreneurial capacity, and to channel philanthropic capital into research that serves the community’s long-term interests. Their leadership must reflect that position.
The failure to develop and elevate HBCU alumni into business school leadership is not simply an administrative oversight. It is a strategic error with consequences that extend well beyond the schools themselves. Every dean recruited from outside the ecosystem without a plan to develop internal successors is a missed compounding opportunity. Every promising scholar who departs for a PWI without a pathway back represents a loss of accumulated institutional knowledge that will not return on its own. Every curriculum designed to satisfy external accreditation standards at the expense of community-relevant content is a semester in which the institution’s potential as an engine of economic development goes partially unrealized.
Graham built his firm on the premise that talent required institutional protection to reach its full potential—that external markets, structured against your community, could not be trusted to recognize or reward what you were building. That premise has lost none of its force. HBCU business schools that internalize it, and act on it with the rigor and consistency it demands, will be better positioned to fulfill the extraordinary institutional promise that their founding represented. Those that continue to defer to external validation and outsourced leadership will find that the promise remains exactly that—unrealized, and over time, increasingly difficult to recover.
Disclaimer: This article was assisted by ClaudeAI.
“Note: These data are based on colleges, universities, affiliated foundations, and related nonprofit organizations that volunteered to participate in NACUBO’s endowment study series.” – NACUBO
Howard University has finally done it. They have become the first HBCU to cross the $1 billion endowment mark. An indelible mark that is now the benchmark for potential to survive the coming admissions cliff that U.S. colleges and universities will face as demographics have acutely shifted from the number of students going to college and the number of colleges who will be able to withstand a downturn. HBCUs (like many smaller colleges and universities) are disproportionately reliant on tuition revenues and government funding to keep the doors open and lights on. The factors are a myriad from low African American wealth to limited investment models for their endowments. The latter being something of a chicken and egg situation whereby when you have less you are more conservative with your investment strategy, but this also leads to minimal returns. Without heavy alumni giving to ensure consistent endowment capital it is hard for HBCUs to take more investment risk.
The PWI-HBCU NACUBO Top 10 Endowment Gap for 2024 stands at $129.2 to $1, which is an increase from 2023’s $128.7 to $1.*
HIGHLIGHTS:
Top 10 HBCU Endowment Total – $2.6 billion*
Top 10 PWI Endowment Total – $336.0 billion
Number of PWIs Above $2 billion – 78
Number of PWIs Above $1 billion – 148
Number of HBCUs Above $1 billion – 1
Number of HBCUs Above $100 million – 8
669 colleges, universities, and education-related foundations completed NACUBO’s FY24 survey and those institutions hold $884.3 billion of endowment assets with an average endowment of $1.3 billion and median endowment of $244.4 million.
HBCUs comprised 1.5 percent of NACUBO’s reporting institutions and 0.3 percent of the reporting endowment assets.
PWI endowments (30) with endowments over $5 billion hold 58.5 percent of the $884.3 billion in endowment assets.
All values are in millions ($000)**
Previous year in parentheses for Endowment Value Per Full-Time Student
**The change in market value does NOT represent the rate of return for the institution’s investments. Rather, the change in the market value of an endowment from FY23 to FY24 reflects the net impact of: 1) withdrawals to fund institutional operations and capital expenses; 2) the payment of endowment management and investment fees; 3) additions from donor gifts and other contributions; and 4) investment gains or losses.
SOURCE: NACUBO
Take a look at how an endowment works. Not only scholarships to reduce the student debt burden but research, recruiting talented faculty & students, faculty salaries, and a host of other things can be paid for through a strong endowment. It ultimately is the lifeblood of a college or university to ensure its success generation after generation.
It is no secret that the world is moving towards a stronger reliance on renewable energy*, but there is a swath of the country that is moving extremely slow to embrace it. That swath is dominated by HBCU/PBI states who still dominantly prefer a traditional energy mix. The move towards renewable energy though is inevitable. This is both for environmental and economic reasons. To the latter, there is a massive investment and entrepreneurship opportunity available to HBCUpreneurs who want to help grow and cultivate the space in their respective states. American Association of Blacks In Energy (AABE) President Ralph Cleveland shared the following thoughts, “We will not meet the demands of energy transformation and climate change without Black institutions. This partnership reinforces the critical role HBCUs play in shaping the face of energy talent, development, and design. Not only do we need to create pathways to the C-Suite but we also need to activate our rich networks for a more inclusive energy ecosystem.” While we agree HBCUs need to create pathways to the C-Suite, we also believe the easiest and most economically empowering path there is to have HBCUs and HBCUpreneurs be the vanguard in creating renewable energy startups as highlighted in The Green Program’s ”19 Black Leaders on the Forefront of Clean Energy’ article. The power in energy like everything else is ultimately in the ownership.
HBCU Money took data from Yale Climate Connections and drilled down to the states that have HBCUs and PBIs located in them to see how the states where African America and its institutions are and will be impacted by the current energy mix in their state and also to highlight the opportunities that lay ahead as well. “Important note: The map shows electricity production within each state’s borders. Many states and utility companies exchange electricity with other states. So this data may not reflect the energy that is actually consumed — as opposed to generated — within each state.”
Why is nuclear not considered a renewable? National Grid states, “Nuclear fuels, such as the element uranium, are not considered renewable as they are a finite material mined from the ground and can only be found in certain locations.”
HIGHLIGHTS:
The average HBCU/PBI state has renewable energy of 12% average and 9% median, respectively.
Wind supplies the highest average renewable energy at 5% overall and hydropower supplies the highest median energy at 3% overall.
Oklahoma, the overall leader, is also the leader in wind energy with 41% of its energy coming from wind.
New York is the hydropower leader among HBCU/PBI states with 23% of its energy mix coming from water.
California is the solar power leader among HBCU/PBI states with 19% of its energy mix coming from the sun.
Only 6 of the 23 states have a double digit renewable energy source in their energy mix. Oklahoma, California, New York, Texas, Tennessee, Illinois.
“Note: These data are based on colleges, universities, affiliated foundations, and related nonprofit organizations that volunteered to participate in NACUBO’s endowment study series.” – NACUBO
With a looming enrollment crisis for all America’s colleges and universities, we are at a time where endowments are not only going to matter more they are going to matter the most. The building of endowments, cutting of some overweight athletic expenses that allow you to invest more, aggressive fundraising efforts, joint investing with other HBCUs, everything should be on the table. This is an arms race for survival. We have been at alert level red for awhile but apparently the sound of the siren has been broken. Now it is fixed and it is blaring. HBCU endowments are a key and integral component to African American wealth building both individually and institutionally. Their importance to African America’s economic survivability, sustainability, and empowerment cannot be overstated enough. That HBCU endowments continue to be that is a matter of conversation about who at HBCUs should be benefitting and prioritized most by our endowments.
HBCU endowment analysis from 2023 will not reflect that Spelman College kicked off 2024 with HBCUs largest ever donation and the first ever nine figure donation with its $100 million donation from Ronda Stryker and William Johnston. We will see how much of the $100 million makes it into Spelman’s actual endowment coffers this time next year, but even without it Spelman leads all HBCUs in NACUBO’s new category of endowment value per full-time equivalent (FTE) student with $197,713 per Spelmanite versus Florida A&M University’s worrisome $6,044 endowment value per full-time equivalent student. This arguably is a more accurate of how healthy a college or university’s endowment is performing to some degree which we covered in ‘Without Hyperactive Alumni, HBCUs Will Bear The Brunt Of The Building Tsunami Of College Closures And The End Of Their Blackness’. Only Spelman College and Meharry Medical College have endowment value per FTE above $100,000. The national average is $174,499 among all college and universities and median is $47,287. HBCUs reporting have an average of $63,861 and median of $19,256.
On the good news from 2023 is Morgan State University and Virginia State University breaking into the $100 million endowment club as only the ninth and tenth HBCUs to do so. It is assumed that Tuskegee University (not reported) based on their FY 2018 Fact Book also has an endowment above $100 million. This means that roughly 10 percent of the remaining HBCUs have endowments above $100 million. Unfortunately, the gap between that group and those below is staggering with there being questions of a larger percentage of HBCUs potentially having no endowment as a possibility. Lastly, unless Spelman comes through with another jaw-dropping donation (it is certainly possible), then at some point in 2024 Howard University’s endowment will cross the $1 billion mark making it the first HBCU to do so.
The PWI-HBCU NACUBO Top 10 Endowment Gap for 2023 stands at $128.7 to $1, which is an increase from 2022’s $127.5 to $1.*
HIGHLIGHTS:
Top 10 HBCU Endowment Total – $2.2 billion
Top 10 PWI Endowment Total – $321.6 billion
Number of PWIs Above $2 billion – 74
Number of PWIs Above $1 billion – 139
Number of HBCUs Above $1 billion – 0
Number of HBCUs Above $100 million – 9
688 colleges, universities, and education-related foundations completed NACUBO’s FY23 survey and those institutions hold $839 billion of endowment assets with an average endowment of $1.2 billion and median endowment of $209.1 million.
HBCUs comprised 1.4 percent of NACUBO’s reporting institutions and 0.3 percent of the reporting endowment assets.
PWI endowments (30) with endowments over $5 billion hold 58 percent of the $839 billion in endowment assets.
*Due to Hampton University and Morehouse College not participating this year significantly altered the Top 10 HBCUs endowment combined total. Therefore, HBCU Money took the editorial liberty of calculating the PWI-HBCU endowment gap based on 2022’s HBCU endowment total of $2.5 billion.
**The change in market value does NOT represent the rate of return for the institution’s investments. Rather, the change in the market value of an endowment from FY21 to FY22 reflects the net impact of: 1) withdrawals to fund institutional operations and capital expenses; 2) the payment of endowment management and investment fees; 3) additions from donor gifts and other contributions; and 4) investment gains or losses.
SOURCE: NACUBO
Take a look at how an endowment works. Not only scholarships to reduce the student debt burden but research, recruiting talented faculty & students, faculty salaries, and a host of other things can be paid for through a strong endowment. It ultimately is the lifeblood of a college or university to ensure its success generation after generation.