
Tag Archives: black credit unions

No Group Works Less for Itself Than African Americans: Just 8% of Black Workers Are Employed by Black-Owned Firms

“When an African American earns $1.00 with our labor, there is an owner that earns $1.20 in operating income from ownership of the vessel and they get to count said vessel as an asset. This means when we do not work for firms from our own community, then the bulk benefit of our talents are still rewarding Others. That reality does not change whether we are earning $80,000 or $8 million. Individual talents are always building up institutional wealth, the question is for our own community or someone else’s.” – William A. Foster, IV

A river does not ask where its water goes. It simply runs, cutting canyons, carrying silt, turning turbines wherever the engineers have built them. For a hundred years, a river ran through a valley and lit every town along its banks, except the town it rose from. That town kept its lanterns. It sent its water downstream and called the arrangement progress, because the workers who built the dam drew a wage, and a wage, everyone insisted, was the same as owning the river. It was not until the town tried to build its own turbine that it discovered the difference: a wage ends when the shift ends. A turbine keeps generating current long after the worker who built it has gone home.

That difference between generating value and owning the mechanism that captures it is the entire story embedded in a figure from Pew Research Center’s analysis of federal business data that ought to stop every Black economist and institution builder in their tracks: Black-owned employer firms in the United States employed roughly 1.6 million workers in 2022, with annual payrolls estimated at $61.2 billion, according to Pew’s review of Census Bureau survey data. Set against the more than 20 million Black Americans in the labor force, that 1.6 million figure is not a success statistic. It is a containment statistic. No group in America works less for itself than African Americans and not because Black workers labor any less than anyone else, but because so little of what that labor builds accrues to institutions Black America actually owns. The river runs. The valley stays dark.

The economist Claud Anderson gave this dynamic its plainest possible name three decades ago in Black Labor, White Wealth: The Search for Power and Economic Justice, arguing that American wealth was built substantially on Black labor under slavery and Jim Crow and has been sustained since through policy and practice that keeps that labor’s output flowing into someone else’s balance sheet rather than its own. Anderson’s proposed remedy, which he later formalized through his organization, the PowerNomics Corporation of America, was not a moral appeal either it was a group-economics strategy aimed squarely at ownership and capital control rather than participation and goodwill. The employment and ownership figures that follow are the modern receipts for exactly the imbalance Anderson named in 1994, updated with three additional decades of federal data that show the imbalance persisting in remarkably precise form.

This is not a moral argument. It is a capacity argument, and the distinction matters, because HBCU Money has never found the moral case persuasive to the people who control capital allocation, and neither should we expect it to be. The self-interest case is the only one that survives contact with a boardroom: an ecosystem that does not own the firms employing its own labor cannot retain the capital that labor generates, cannot direct where that capital gets reinvested, and cannot build the institutional density required to negotiate as a bloc rather than beg as individuals. Ownership is not a symbolic preference. It is the only mechanism by which labor output converts into compounding capital instead of a paycheck that clears and disappears.

Start with the scale problem, because it is worse than the employment figure alone suggests, and it is worse specifically relative to every other ownership group tracked by the federal government. According to the U.S. Census Bureau’s most recent release on business owner characteristics, Black or African American-owned firms account for 3.4% of U.S. employer businesses, up from 2.7% just two years earlier per Brookings’ analysis of the Annual Business Survey — real movement, but movement from a base so small it barely changes the fundamental picture. Put the ownership share next to the population share and the comparison sharpens considerably: Brookings researchers Andre Perry, Manann Donoghoe, and Hannah Stephens found that in 2021, white Americans owned 82% of employer businesses while representing 72.5% of the population, its ownership exceeding population share by nearly ten points. Asian Americans owned 10.9% of employer businesses against a 6.3% population share — again, ownership exceeding population. Black Americans owned 2.7% of employer businesses against a 14.4% population share, and Hispanic or Latino Americans owned 6.9% against a 19.1% population share, both groups locked well below proportional representation, with Black America carrying the widest gap of any racial category Brookings measured. That is not a rounding error. It is a four-to-one to five-to-one density gap between population share and ownership share depending on which year you measure, and it is the single most important number in this entire conversation, because density is what everything else depends on.

The size distribution inside that 3.4% makes the containment tighter still, and here the comparison across ownership groups is unusually clean because the federal data measures the same thing the same way for everyone: what share of each group’s businesses employ nobody at all. Per the same Brookings analysis of Census sole-proprietorship data, Black-owned businesses are the most concentrated of any racial group at that zero-employee scale where 96.3% are sole proprietorships with no paid staff, compared with 92.4% for both Hispanic/Latino-owned and Native American-owned firms, and 81.1% for white-owned firms and 80.1% for Asian American-owned firms. Run the comparison from the employer side and, per Pew’s analysis, it holds just as tightly: about seven-in-ten Black-owned employer firms had between one and nine employees in 2022, a concentration at the smallest possible operating scale that leaves the ownership tier structurally unable to absorb meaningful shares of the available Black labor force even if every one of those firms doubled tomorrow.

The dollar-value version of the same gap is, if anything, more damning, because it isn’t about headcount at all, it’s about what each firm is actually worth once it exists. Using the Census Bureau’s most recent figures, white-owned employer firms generated roughly $17.0 trillion in combined receipts across 4.8 million firms, an average of about $3.5 million in receipts per firm. Black-owned employer firms generated $249.0 billion in combined receipts across 201,000 firms, an average of roughly $1.2 million in receipts per firm, meaning the typical white-owned firm generates nearly three times the revenue of the typical Black-owned firm. Asian-owned firms averaged about $1.75 million per firm and Hispanic-owned firms about $1.47 million, both ahead of the Black-owned average as well.

Two further measurements explain why that revenue gap exists rather than merely documenting that it does, and both point to the same conclusion Anderson reached in 1994: the constraint is access, not capacity. The first is sector composition. Per Pew’s sector breakdown, Black-owned employer firms are concentrated in health care and social assistance (26% of all Black-owned firms), professional and scientific services (14%), transportation and warehousing (9%), administrative and waste management services (8%), and retail and food service (7% each) — sectors that require comparatively little startup capital and generate correspondingly modest revenue per firm. Black ownership is nearly absent from the industries that produce the highest revenue per firm precisely because those industries — utilities, wholesale trade, heavy manufacturing — demand the largest upfront capitalization to enter at all; Brookings researchers note that a 2018 federal survey recorded a total of just 18 Black-owned businesses nationally in the entire utilities sector. Economist Robert Fairlie’s research for the National Bureau of Economic Research finds the same pattern from a different angle: roughly 18% of Black workers are employed in innovation-intensive industries compared with 22% of white workers, and even among Black workers already employed inside them, only about 9% go on to own a business in that industry compared with roughly 14% of white workers in the same position. Tellingly, a study by the Initiative for a Competitive Inner City found that where Black-owned manufacturers do exist inside tracked supply chains, they are on average larger than the white-owned manufacturers in those same chains, the clearest available evidence that this is a barrier to entry, not a deficit of competence, ambition, or business acumen.

The second measurement is the investor class itself, and here the gap dwarfs everything discussed so far. Per Crunchbase data, Black-founded startups received roughly 0.4% of all U.S. venture capital in 2024, down from a 2021 peak of 1.3%, and according to HBCUvc’s quarterly funding tracking, only 17% of Black-founded deals that do get funded reach a Series A round, compared with 37.7% of funded deals overall meaning the small number of Black-founded firms that clear the first hurdle are roughly half as likely to clear the second one. The lending side of the ledger shows the identical pattern in a different market: the Federal Reserve’s Small Business Credit Survey finds Black-owned firms denied credit at roughly 39%, more than double the 18% denial rate for white-owned firms, and a 2021 Federal Reserve Bank of New York report found Black-owned firms independently rated low credit risk were approved for full financing at close to the same rate as high-risk white-owned firms.

But the venture and lending statistics both describe capital that a firm is applying for from someone else. The layer underneath both of them is capital a founder never has to apply for at all, because it comes from their own household or their own network before any bank or investor is ever approached and this is where the wealth gap already documented in this piece does its most permanent damage. According to Google for Startups’ own reporting on the pre-seed funding gap, the average U.S. startup launches on a friends-and-family round of $100,000 to $150,000, drawn from founders’ personal savings and the people closest to them; for Black founders, that figure averages closer to $35,000. Measured on a liquid-wealth basis stripping out home equity, since a house cannot be cashed out to fund a check, a 2023 analysis by Fifth Star Funds put the white-to-Black wealth ratio at roughly twenty-two-to-one, meaning a Black founder trying to raise a typical $23,000 friends-and-family round would need to draw on the entire liquid wealth of six Black families to do it. A firm that cannot clear this round never reaches the point of being denied a bank loan or passed over by a fund; it simply launches undercapitalized, if it launches at all, and stays capped near sole-proprietor scale for the rest of its life which is a large part of why it stays there. The historical contrast needs no editorializing: Bloomberg’s reporting on Amazon’s founding, later summarized by Newser, found Amazon’s 1995 seed round included $245,573 personally invested by Jeff Bezos’s own parents, Jackie and Mike Bezos. And per multiple retellings of Google’s founding, including Celebrity Net Worth’s account of its earliest investors, Google’s first outside money, three years later, arrived as $100,000 personal checks from Stanford computer science professor David Cheriton and Sun Microsystems co-founder Andy Bechtolsheim, written before the company was even legally incorporated, followed within weeks by a $250,000 personal investment from Bezos himself. No institution of any kind was involved in either case. The capital that mattered most was already sitting in a family’s bank account.

The handful of Black-led investment vehicles that do exist compound this problem rather than solve it, and the reason is worth stating plainly rather than glossing over: Black households cannot yet supply enough investable wealth to anchor those funds as limited partners, and Black institutions — banks, credit unions, HBCU endowments, pension-adjacent capital pools — are not yet large enough collectively to do it either. A Black general partner running a fund capitalized primarily by Others’ foundations, endowments, and pension systems has changed who makes the investment decisions without changing who ultimately owns the return, which means fund formation at the top of the capital stack and household wealth at the bottom of it are not two separate problems. They are the same institutional density gap, expressed at two different altitudes.

Five separate measurements now point at the same wall: Black-owned firms are underrepresented in raw count relative to population, overrepresented at the smallest employee-size tier, smaller in average dollar value, concentrated in the lowest-capital sectors, and shut out of the personal, venture, and institutional capital that would move a firm generating $1.2 million in revenue toward the $3.5 million white-owned average. Five measurements, one underlying constraint.

The historical context here is not ancient, and it runs on two tracks that arrive at the same conclusion from different directions. Where Anderson traced the mechanism backward through slavery and Jim Crow policy, the sociologist Thomas Shapiro traced it forward through household balance sheets a decade later, arguing in The Hidden Cost of Being African American that income and wealth are not the same variable, and that the persistence of racial inequality runs through the asset side of the ledger rather than the wage side. Employment, even full employment, even rising Black employment, does not close a wealth gap if the employer capturing the surplus value of that labor sits outside the community. This is precisely why the Federal Reserve’s Survey of Consumer Finances, as analyzed by the National Community Reinvestment Coalition, shows the gap widening in dollar terms even as it narrows in percentage terms: median Black household wealth rose from roughly $28,000 to $44,900 between 2019 and 2022, but median wealth overall rose enough that the absolute gap between Black and white households actually grew by nearly $50,000 over the same period. By 2022, the median white household held $284,310, more than six times the $44,100 held by the median Black household. Labor income is necessary. It has never been sufficient. A wage is a flow; a firm is a stock. You cannot out-earn a four-to-one ownership density gap through salary alone, no matter how many Black workers show up for shifts at other people’s companies.

There is a growth signal worth taking seriously here, and HBCU Money should not undersell it even while insisting the baseline remains inadequate. Per Census Bureau data reported by Governing, the number of Black-owned employer businesses grew nearly 57% between 2017 and 2022, and Black-owned firms accounted for more than half of all new employer businesses started nationally in that period. In the most recent year-over-year comparison available across all racial groups, Brookings found Black-owned employer businesses posted the largest percentage increases in employee count, revenue, and payroll of any group tracked employee growth of 7%, revenue growth of 30%, and payroll growth of 27%, each figure running 5 to 10 percentage points ahead of white, Asian American, and Hispanic firms over the same year. Formation is not the same as capacity, however, and the arithmetic of closing a base this small is unforgiving: Brookings analysts estimate it would take roughly 700,000 additional Black-owned employer firms to bring ownership into line with Black population share, representing an estimated $800 billion in additional revenue and 6 million additional jobs and that at the pace of the single best growth year on record, full parity remains roughly 100 years away.

The strategic implications follow directly from the density problem, and this is where the four throughlines this publication returns to — institutional density, capital retention, talent concentration, and strategic coordination — stop being abstractions and start functioning as a diagnostic. Institutional density is the root constraint: 201,000 Black-owned employer firms against 5.9 million total U.S. employer firms, per the Census Bureau, means the ecosystem simply does not have enough vessels to hold its own labor, and those vessels that do exist are smaller both in headcount and in revenue than their counterparts in every other ownership category and are locked, disproportionately, into the sectors and financing markets least able to change that. Capital retention fails as a direct downstream consequence. Talent concentration is the third casualty: the most capable Black managers, engineers, and operators in the country are overwhelmingly employed inside institutions Black America does not control. And strategic coordination; the ability to move Black labor, Black capital, and Black institutional leadership as a single directed force, precisely the coordination Anderson’s PowerNomics called for cannot exist at scale when the typical Black-owned firm is roughly a third the revenue size of the typical white-owned firm, is concentrated outside the industries capable of scaling, has almost no access to personal, venture, or institutional growth capital, and when 92 of every 100 Black workers punch in somewhere the community has no ownership stake in the firm.

This is where the banking and credit union infrastructure this publication tracks obsessively becomes the actual lever, not a side note though it is now clear that lever needs a second one built alongside it. According to HBCU Money’s own 2025 African American-Owned Bank Directory and African American-Owned Credit Union Directory, there are 17 African American-owned banks in the country holding roughly $6.72 billion in combined assets, and 205 African American-owned credit unions holding roughly $8.15 billion across nearly 727,000 members, a combined $15 billion in institutional balance sheet capacity sitting underneath a labor force generating tens of billions in annual wages that mostly clears through mainstream white-owned lenders instead. Only a small fraction of HBCUs and PBIs themselves bank with African American-owned institutions, per that same directory data, a fact that should embarrass every finance department at every one of the 100 plus federally designated HBCUs and PBIs. But deposit infrastructure alone cannot close the sector-composition gap, the friends-and-family gap, or the institutional-capital gap, those require a growth-equity layer this ecosystem still largely lacks, and building it will require Black institutional balance sheets to grow enough to anchor it themselves, not simply put a Black name on someone else’s money.

Business schools at institutions like Fort Valley State, Chicago State, Grambling, and Norfolk State are training a pipeline of Black finance, accounting, and management talent every year, talent that overwhelmingly gets absorbed into the same non-Black employer base generating the 1.6 million versus 20 million imbalance Pew’s data documents in the first place. The concrete institutional solution is not a slogan about entrepreneurship; it’s coordination between four things that currently operate as strangers to each other: the HBCU business school pipeline producing operators, the $15 billion Black bank and credit union balance sheet capacity that can underwrite working capital, an equity and growth-capital layer purpose-built and Black-capitalized to move firms out of the lowest-capital sectors and into the high-revenue ones currently closed to them, and the roughly 200,000 existing Black-owned employer firms that need all three of those pieces to grow past the headcount ceiling, the revenue ceiling, and the sector ceiling that currently trap the median firm below every comparable ownership group.

The employment share figure — 1.6 million out of a labor force many multiples that size — is not a statistic to mourn. It is a target with a number attached, and the comparative data makes the target legible in five dimensions at once: more firms, larger firms, firms worth more per dollar of revenue, firms operating in higher-capital sectors, and firms with actual access to the capital — personal, venture, and institutional — that funds growth. Anderson named this arrangement in 1994. The federal government has spent every year since generating the receipts that prove him right. No group works less for itself than African Americans; not for lack of labor, and not for lack of the firms willing to try, but for lack of the sectors, the capital, and the institutions built to keep that labor’s output at home.

Disclaimer: This article was assisted by ClaudeAI.

Consumer Credit Now Rivals Mortgage Debt in African American Households

First our pleasures die – and then our hopes, and then our fears – and when these are dead, the debt is due dust claims dust – and we die too. – Percy Bysshe Shelley

African American household assets reached $7.1 trillion in 2024, a half-trillion-dollar increase that might appear encouraging at first glance. Yet beneath this headline figure lies a structural vulnerability that threatens to undermine decades of hard-won economic progress: consumer credit has surged to $740 billion, now representing nearly half of all African American household debt and approaching parity with home mortgage obligations of $780 billion. In the world of good debt versus bad debt, African America’s bad debt is rapidly choking the economic life away.

This near 1:1 ratio between consumer credit and mortgage debt represents a fundamental inversion of healthy household finance. For white households, the ratio stands at approximately 3:1 in favor of mortgage debt over consumer credit. Hispanic households maintain a similar 3:1 ratio, as do households classified as “Other” in Federal Reserve data. The African American community stands alone in this precarious position, where high-interest, unsecured borrowing rivals the debt secured by appreciating assets.

The implications of this structural imbalance extend far beyond mere statistics. They reveal a community increasingly dependent on expensive credit to maintain living standards, even as asset values nominally rise. Consumer credit grew by 10.4% in 2024, more than double the 4.0% growth in mortgage debt and far exceeding the overall asset appreciation rate. This divergence suggests that rising property values and retirement account balances are not translating into improved financial flexibility. Instead, African American households appear to be running faster merely to stay in place, accumulating debt at an accelerating pace despite wealth gains elsewhere on their balance sheets.

What makes this dynamic particularly insidious is the extractive nature of the debt itself. With African American-owned banks holding just $6.4 billion in combined assets, a figure that has grown modestly from $5.9 billion in 2023, the overwhelming majority of the $1.55 trillion in African American household liabilities flows to institutions outside the community. This represents one of the most significant, yet least discussed, mechanisms of wealth extraction from African America.

Consider the arithmetic: if even a conservative estimate suggests that 95% of African American debt is held by non-Black institutions, and if that debt carries an average interest rate of 8% (likely conservative given the prevalence of credit card debt and auto loans), then African American households are transferring approximately $120 billion annually in interest payments to institutions with no vested interest in Black wealth creation or community reinvestment.

For context, the entire asset base of African American-owned banks—$6.4 billion—represents less than one month’s worth of these interest payments. The disparity is staggering. According to the FDIC’s Minority Depository Institution program, Asian American banks lead with $174 billion in assets, while Hispanic American banks hold $138 billion. African American banking institutions, despite serving a population with $7.1 trillion in household assets (yielding approximately $5.6 trillion in net wealth after liabilities), control less than 0.1% of that wealth through their balance sheets.

This extraction mechanism operates at multiple levels. First, there is the direct transfer of interest payments from Black borrowers to predominantly white-owned financial institutions. Second, there is the opportunity cost: capital that could be intermediated through Black-owned institutions creating deposits, enabling local lending, building institutional capacity but instead enriches institutions that have historically redlined Black communities and continue to deny Black borrowers and business owners at disproportionate rates.

Third, and perhaps most pernicious, is the feedback loop this creates. Without sufficient capital flow through Black-owned institutions, these banks lack the resources to compete effectively for deposits, to invest in technology and branch networks, to attract top talent, or to take on the larger commercial loans that could finance transformative community development projects. They remain, in effect, trapped in a low-equilibrium state unable to scale precisely because they lack access to the very capital that their community generates.

The near-parity between consumer credit and mortgage debt in African American households signals a fundamental divergence from the wealth-building model that has enriched other communities for generations. Mortgage debt, despite its costs, serves as a mechanism for forced savings and wealth accumulation. As homeowners make payments, they build equity in an asset that typically appreciates over time. The debt is secured by a tangible asset, carries relatively low interest rates, and benefits from tax advantages.

Consumer credit operates on precisely the opposite logic. It finances consumption rather than investment, carries interest rates that can exceed 20% on credit cards, builds no equity, and offers no tax benefits. When consumer credit approaches the scale of mortgage debt, it suggests a household finance structure tilted toward consumption smoothing rather than wealth building—using expensive borrowing to maintain living standards in the face of inadequate income growth.

The data from HBCU Money’s 2024 African America Annual Wealth Report confirms this interpretation. While African American real estate assets totaled $2.24 trillion, growing by just 4.3%, consumer credit surged by 10.4%. This divergence suggests that home equity, the traditional engine of African American wealth building, is being offset by the accumulation of high-cost consumer debt.

More troubling still, the concentration of African American wealth in illiquid assets with real estate and retirement accounts comprising nearly 60% of total holdings limits the ability to weather financial shocks without resorting to consumer credit. Unlike households with significant liquid assets or equity portfolios that can be tapped through margin loans at lower rates, African American households facing unexpected expenses must often turn to credit cards, personal loans, or other high-cost borrowing.

This creates a wealth-to-liquidity trap: substantial assets on paper, but insufficient liquid resources to manage volatility without accumulating expensive debt. The modest representation of corporate equities and mutual funds at just $330 billion, or 4.7% of African American assets means that most Black wealth is locked in homes and retirement accounts that cannot easily be accessed for emergency expenses, business investments, or wealth transfer to the next generation.

The underdevelopment of African American banking institutions represents both a cause and consequence of this debt crisis. With combined assets of just $6.4 billion, Black-owned banks lack the scale to compete effectively for deposits, to offer competitive loan products, or to finance the larger commercial and real estate projects that could drive community wealth creation.

To understand why bank assets matter for addressing household debt, one must grasp a fundamental principle of banking: a bank’s assets are largely composed of the loans it has extended. When a bank reports $1 billion in assets, the majority represents money lent to households and businesses in the form of mortgages, business loans, and lines of credit. These loans are assets to the bank because they generate interest income and (ideally) will be repaid. Conversely, the deposits that customers place in banks appear as liabilities on the bank’s balance sheet, because the bank owes that money back to depositors.

This means that when African American-owned banks hold just $6.4 billion in assets, they have extended roughly $6.4 billion in loans to their communities. By contrast, African American households carry $1.55 trillion in debt. The arithmetic is stark: Black-owned institutions are originating less than 0.5% of the debt carried by Black households. The remaining 99.5% or approximately $1.54 trillion flows to non-Black institutions, carrying interest payments and fees with it. If Black-owned banks held even 10% of African American household debt as assets, they would control over $155 billion in lending capacity more than twenty times their current scale creating a powerful engine for wealth recirculation and community reinvestment.

The exclusion from consumer credit is even more complete than these figures suggest. There are no African American-owned credit card companies, and most African American financial institutions lack the scale and infrastructure to issue Visa, MasterCard, or other branded credit cards through their own institutions. When Black consumers carry $740 billion in consumer credit much of it on credit cards charging 18% to 25% interest virtually none of that debt flows through Black-owned institutions. Every swipe, every interest payment, every late fee enriches the handful of large banks and card issuers that dominate the consumer credit market. This represents the most direct and lucrative form of wealth extraction: high-margin, unsecured lending with minimal default risk due to aggressive collection practices, all flowing entirely outside the Black banking ecosystem.

By comparison, a single large regional bank might hold $50 billion or more in assets. The entire African American banking sector commands resources equivalent to roughly one-eighth of one large institution. This scale disadvantage manifests in multiple ways: higher operating costs as a percentage of assets, limited ability to diversify risk, reduced capacity to invest in technology and marketing, and difficulty attracting deposits in an era when consumers increasingly prioritize digital capabilities and nationwide ATM access.

The decrease of Black-owned banks has accelerated these challenges. The number of African American-owned banks has declined from 48 in 2001 to just 18 today, even as the combined assets have grown from $5 billion to $6.4 billion. This suggests that the survivors have achieved modest scale gains, but the overall institutional capacity of the sector has contracted significantly. Each closure represents not just a loss of financial services, but a loss of community knowledge, relationship banking, and the cultural competence that enables Black-owned institutions to serve their communities effectively.

The credit union sector presents a more substantial but still constrained picture. Approximately 205 African American credit unions operate nationwide, holding $8.2 billion in combined assets and serving 727,000 members. While this represents meaningful scale more than the $6.4 billion held by African American banks the distribution reveals deep fragmentation. The average credit union holds $40 million in assets with 3,500 members, but the median tells a more sobering story: just $2.5 million in assets serving 618 members. This means the majority of African American credit unions operate at scales too small to offer competitive products, invest in digital banking infrastructure, or provide the full range of services that members need. Many church-based credit unions, while serving vital community functions for congregations often underserved by traditional banks, hold assets under $500,000. The member-owned structure of credit unions, while fostering community engagement and democratic governance, also constrains their ability to raise capital through equity markets, leaving them dependent on retained earnings and member deposits for growth, a particular challenge when serving communities with limited surplus capital.

This institutional deficit has profound implications for the debt crisis. Without strong Black-owned financial institutions, African American borrowers must rely on financial institutions owned by other communities that often offer less favorable terms. Research consistently shows that Black borrowers face higher denial rates, pay higher interest rates, and receive less favorable terms than similarly situated white borrowers. A 2025 LendingTree analysis of Home Mortgage Disclosure Act data found that Black borrowers faced a mortgage denial rate of 19% compared to 11.27% for all applicants making them 1.7 times more likely to be denied. Black-owned small businesses received full funding in just 38% of cases, compared with 62% for white-owned firms.

These disparities push African American households and businesses toward more expensive credit alternatives. Unable to access conventional mortgages, they turn to FHA loans with higher insurance premiums. Denied bank credit, they turn to credit cards and personal loans with double-digit interest rates. Lacking access to business lines of credit, entrepreneurs tap home equity or personal savings, increasing their financial vulnerability.

The absence of robust Black-owned institutions also deprives the community of an important competitive force. Where Black-owned banks operate, they create pressure on other institutions to serve Black customers more fairly. Their presence signals that discriminatory practices will drive customers to alternatives, creating at least some market discipline. Where they are absent or weak, that discipline evaporates.

Corporate DEI programs that once channeled deposits to Black-owned banks have been largely eliminated. The current federal political environment is openly hostile to African American advancement, with programs like the Treasury Department’s Emergency Capital Investment Program facing uncertain futures. External support structures are collapsing precisely when they are most needed, leaving African American institutions and individuals as the primary actors in their own financial liberation, a task made exponentially more difficult by the very extraction mechanisms this analysis has documented.

The near-parity between consumer credit and mortgage debt in African American households is not a reflection of poor financial decision-making or cultural deficiency. It is the predictable outcome of structural inequalities that have limited income growth, constrained access to affordable credit, concentrated wealth in illiquid assets, and prevented the development of financial institutions capable of serving the Black community effectively.

The comparison with other racial and ethnic groups is instructive. White, Hispanic, and other households all maintain mortgage-to-consumer-credit ratios of approximately 3:1 or better. They achieve this not because of superior financial acumen, but because they benefit from higher incomes, greater intergenerational wealth transfers, better access to credit markets, and stronger financial institutions serving their communities.

African American households, by contrast, face headwinds at every turn. Median Black household income remains roughly 60% of median white household income. The racial wealth gap, at approximately 10:1, ensures that Black families receive less financial support from parents and grandparents. Discrimination in credit markets, though illegal, persists in subtle and not-so-subtle forms. And the institutional infrastructure that might counterbalance these disadvantages from Black-owned banks, investment firms, insurance companies remains underdeveloped and undercapitalized.

The result is a community that has achieved a nominal wealth of $5.5 trillion, yet finds that wealth increasingly built on a foundation of expensive debt rather than appreciating assets and productive capital. The $740 billion in consumer credit represents not just a financial liability, but a transfer mechanism that annually extracts tens of billions of dollars from the Black community and redirects it to predominantly white-owned financial institutions.

Breaking this pattern will require more than incremental change. It will require a fundamental restructuring of how capital flows through the African American community, how financial institutions serving that community are capitalized and regulated, and how wealth is built and transferred across generations. The alternative of continuing on the current trajectory is a future in which African American households accumulate assets while simultaneously accumulating debt, running faster while falling further behind, building wealth that proves as ephemeral as the credit that increasingly finances it.

The data from HBCU Money’s 2024 African America Annual Wealth Report provides both a warning and an opportunity. The warning is clear: the current path is unsustainable, with consumer credit growing at more than double the rate of asset appreciation and institutional capacity remaining stagnant. The opportunity is equally clear: with $5.5 trillion in household wealth, the African American community possesses the resources necessary to build the financial institutions and wealth-building structures that could transform debt into equity, consumption into investment, and extraction into accumulation.

The question is whether the community, and the nation, will recognize the urgency of this moment and take the bold action necessary to recirculate capital, rebuild institutions, and restructure household finance before the debt trap closes entirely. The answer to that question will determine not just the financial trajectory of African American households, but the capacity of African America rise in power and to address the racial wealth gap that remains its most persistent economic failure.

Disclaimer: This article was assisted by ClaudeAI.
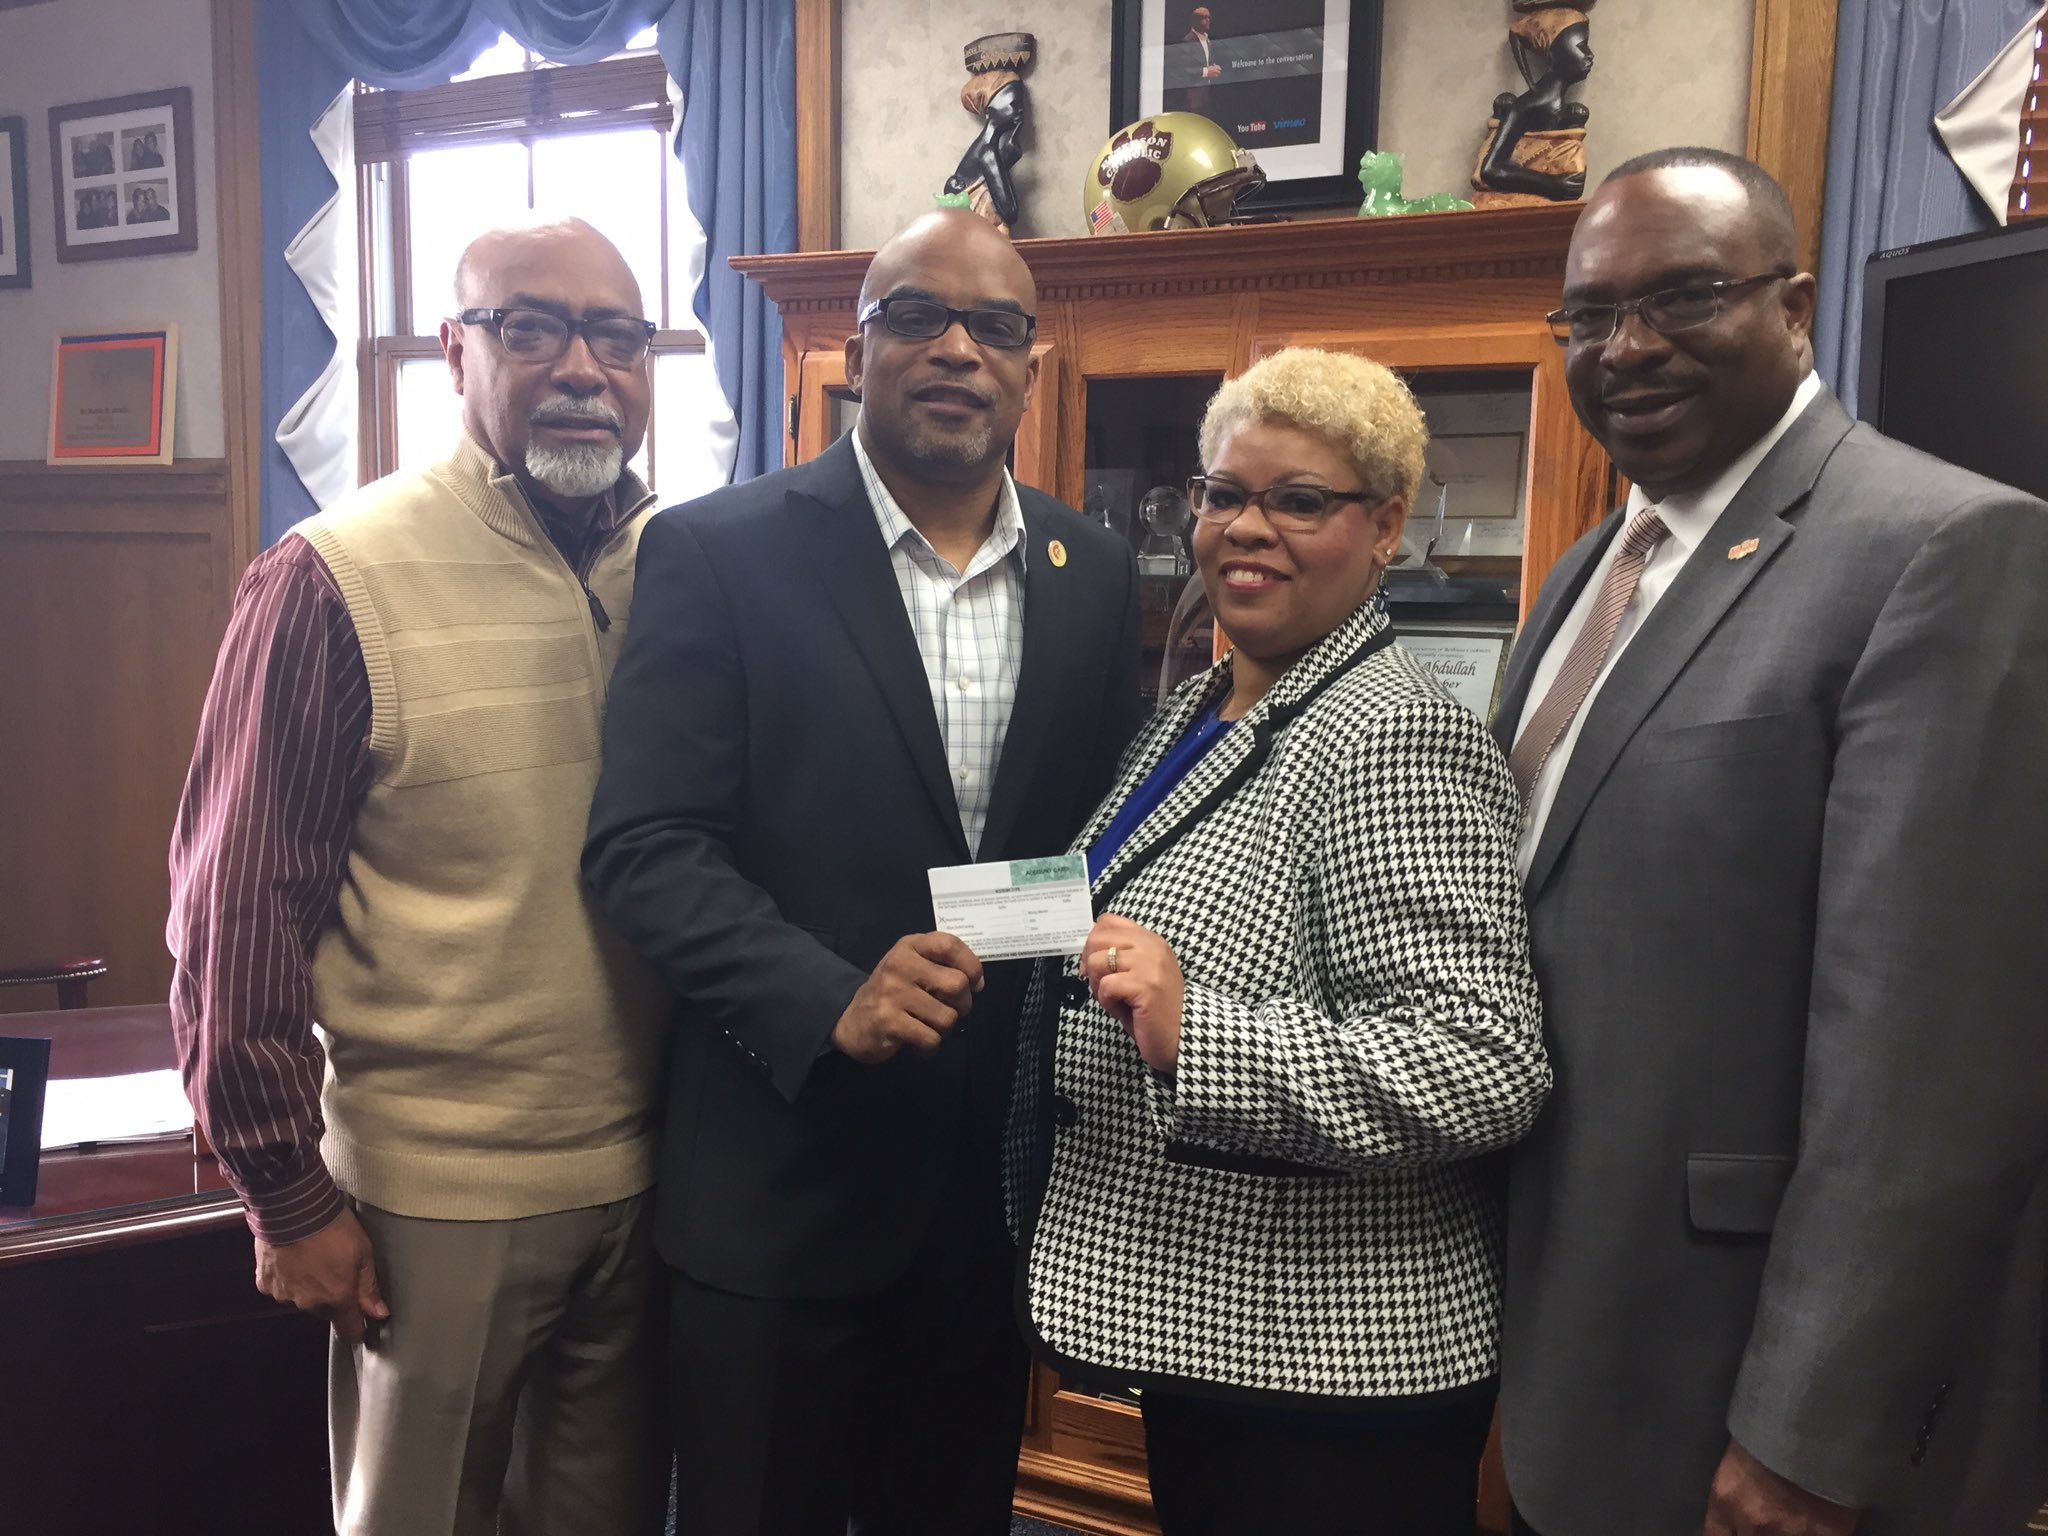
Virginia State’s President Abdullah Leading By Example: Establishes Banking Relationship at VSU Credit Union

c2jwujaxaaaqfio

In a release on Twitter, Kevin Davenport, Virginia State University’s Chief Financial Officer, announced that President Makolah Abdullah would be establishing a personal banking relationship with Virginia State University Federal Credit Union, which is the  fourth largest HBCU-based credit union with $8.6 million assets.

It is a move that is prominent after the massive banking black movement began last year. Noted web traffic to HBCU Money would spike anytime there was a police shooting last year to our African American Bank and Credit Union directories. Many African American owned banks and credit unions reporting thousands of accounts being opened and millions of dollars being moved as African Americans looked to take more ownership of their economic power. The movement also coupled with years of financial abuse by banks like Wells Fargo, Bank of America, and others towards the African American community.

The decision by President Abdullah is an important moment as college presidents tend to be more a more financially affluent group. Financially affluent African Americans have often been a group that has been missing among African American owned financial institutions as clients, leaving many institutions to try and survive by piecemealing less financially stable customers and contributing to decades of stagnant products and services offered. We hope this will spur many other HBCU presidents to move their banking relationships and continue to set the example for their students and our community that in order to build a stronger African American ecosystem our institutions, all of them, need our support, investment, and patronage.

Of course, the major missing piece is moving institutional accounts. HBCUs control billions in institutional money and could significantly enlarge the $10.4 billion that is now controlled by 339 African American owned banks and credit unions left. However, very few African American financial institutions are capable of handling institutional accounts. Currently, OneUnited Bank, the largest African American owned bank or credit union with $648 million in assets, has two HBCUs, Roxbury Community College and Florida Memorial as institutional clients. As the banks and credit unions become more stable with growing deposits from individuals, then they will be able to offer the more complex products that institutions and businesses need. So while President Abdullah maybe just one account, the halo effect could begin a second wave in the #BankBlack movement in 2017 and beyond.


HBCU Money’s 2016 African American Owned Credit Union Directory

imgpsh_fullsize

All credit unions are listed by state and in alphabetical order. In order to be listed in our directory the credit union must have an African American designation. Click on the state to view the full list available. If the credit union has a website you can click on the name and go directly to their website.

There are 318 African American designated credit unions with assets totaling approximately $5.8 billion in assets or approximately 0.51 percent of African America’s $1.1 trillion in buying power. African American credit unions have a total of 863 670 members.

ADDITIONAL NOTES:

  • African American credit unions comprise 49.6 percent of Minority Serving credit unions and 5.2 percent of all US credit unions
  • The total assets for all US minority credit unions is $36.4 billion, with AACUs controlling 16.2 percent of those assets. Total combined assets for all US credit unions are $1.2 trillion, with AACUs controlling 0.48 percent of total American credit union assets.
  • AACUs average assets: $18.4 million ($17.9 million)
  • AACUs average number of members 2 725 (2 688)
  • AACUs median assets: $1.4 million ($1.4 million)
  • AACUs median members: 505 (491)
  • For comparison, Asian American credit unions have approximately 362 000 members and $4.6 billion in assets. Average and median assets of $83.1 million and $30.0 million, respectively.

African American Owned Credit Unions by State:

Alabama

Arkansas

California

Connecticut

District of Columbia

Delaware

Florida

Georgia

Illinois

Indiana

Kentucky

Louisiana

Maryland

Massachusetts

Michigan

Mississippi

New Jersey

New York

North Carolina

Ohio

Pennsylvania

South Carolina

Tennessee

Texas

Virginia

Virgin Islands

Washington

West Virginia

Wisconsin