“You know our people, they want their leaders to be prosperous. One hand washes the other.” – Brother Baines (character from Malcolm X)

Recently in Third Ward, an area rich with historic significance to the city’s African American population there was a battle being engaged between the neighborhood of Oak Manor University Woods and their “neighbor” Wheeler Avenue Baptist Church. WABC had already purchased one entire street of forty some homes in the neighborhood and was in the process of expanding once again as its membership had swelled. The church for all intentions appears on its way to becoming one of Houston’s mega-churches. For Oak Manor University Woods, they seemed to be getting closed in on all sides. The current president of the Oak Manor University Woods Civic Club Bettie Patterson said, “I thought the University of Houston would be our albatross, not Wheeler Avenue.” She was referring to the University of Houston’s presence in Third Ward, which itself has spurred a great deal of the rise in gentrification in the area as the school’s profile as a tier one university has attracted a lot of redevelopment in the area. Many homes in the neighborhood on the tax roles see their lots valued for more than the actual homes themselves. Inside Houston’s Inner Loop, land and affordable housing have become something of an oxymoron. Houston, the fourth largest city in the United States, has been booming with high oil prices spurring most of that boom. Unfortunately, African Americans inside the loop have been the primary victims of that boom. Sitting on what has been historically underdeveloped and depressed land and neighborhoods, many developers (or churches) come in and offer many African American home and landowners under market value prices to scoop up the land. Most lack the financial aptitude or savviness to deal with these fast talking developers or churchmen claiming to be doing God’s work and end up selling their land and homes. In the aftermath, they are not able to afford to stay in their community or forced to sell as taxes have skyrocketed due to rising values and payments they can not maintain, with many of the community’s senior citizens on fixed income. In the Oak Manor University Woods and Wheeler Avenue Baptist case, where the church could be working with the neighborhood to build affordable housing, it is instead engaged in battle that will eventually lead to over sixty homes being demolished and over 200 potential African Americans not in the area. The irony, those 200 may drive from some distance to attend the church and after church if they intend to eat or do any shopping, virtually none of the stores will be owned by African Americans in the area or community. It appears we have pushed all of our chips in on the church, and if it can not save us, then we do not want to be saved.
In some ways, I feel sorry for the African American church. It is essentially being asked to be everything institutionally in the development cycle for African America. Every institution whether it is a neighborhood, church, bank, lobbying group, etc. falls under one of three institutional categories of social, economic, or political. The SEP cycle of development follows that exact order in fact. Social institutional development comes first, then economic institutional development, and lastly political institutional development. A church, by its very nature, is suppose to be a social institution. It is a place where social norms and cultural capital is circulated amongst a community. Other social institutions are things like families, neighborhoods, and schools. All circulating a particular a set of norms and values. Economic institutions are businesses, investors, and even banks. The latter has the unique charge of helping circulate capital and exporting financial risk from the community that owns it onto other communities. An acute problem African Americans experience with predatory financial services from institutions like Wells Fargo who just settled for $175 million with the Department of Justice for its predatory behavior with African Americans. Political institution examples are political parties, lobbyist, and PACs. The institutional cycle always follows the same pattern. Currently, the black church though is being asked to be all three. A feat that no institution can pull off. College and universities are social institutions that often serve the needs of economic and political institutional development through their research, but ultimately are still social institutions. The last I checked, there is no research being conducted in the halls of black churches.
Yet, African America has put all of its stock into this institution and starving the independent development of a strong economic and political institutional development. Although many churches are profitable like businesses, they often lack the serious institutional infrastructure or aptitude to operate as such. Last year, HBCU Money’s first ever African American Credit Union Directory in 2014 uncovered some startling findings about the church’s role in African America’s economic institutional landscape. Religious affiliated credit union make up 5.6 percent of US credit unions, while African American religious affiliated credit unions comprise approximately one-third of all African American credit unions and almost one-fourth of all US religious affiliated credit unions. In California, all seven African American credit unions in 2014 were religious affiliated. The sensible thing for them to do would have been if they absolutely had to form their own (as opposed to banking at an African American owned bank or credit union) was for all seven to form one and call it the “Insert famous African-American religious figure from California” of California Federal Credit Union. It would have been a credit union with seven branches, 1 485 members, and $1.7 million in assets. Instead, the median membership and assets among the seven separately was 152 and $165 000, respectively. In other words, not worth the paperwork it probably took to form them and likely limited opportunity for any real scalability or sustainability.
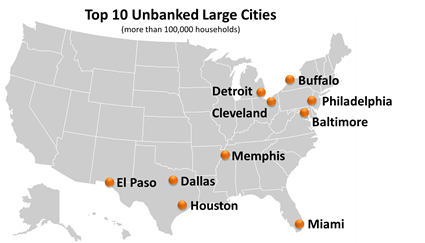
It is both a gift and curse that one-third of African American credit unions are religious based. The gift is that any opportunity for African Americans that increases financial engagement is a benefit. The Center for American Progress reports, “For African Americans, the unbanked rate declined slightly from 21.4 percent in 2011 to 20.5 percent in 2013, and the underbanked rate decreased from 33.9 percent to 33.1 percent.” Nationally, the figure for unbanked and underbanked was 7.7 percent and 20 percent, respectively. Having more financial institution options is a good thing. The presence of credit unions, be they religious or not, in African America decreases the probability of predatory financial services like payday loans that are often prevalent in our community coming in to fill the void. However, the problem for having such a disproportionate amount of credit unions being religious based is that these credit unions have no ability to scale as the aforementioned example in California showed, which further means they are limited in the types and number of financial services and products they can offer. The reality is that churches are not equipped to be financial institutions and religious based credit unions are limited to the size of their congregation to their growth potential. They also tend to lack the intellectual expertise to grow and perform the functions that provide for stability of operation for their members and the communities they are in. Often times, these religious based credit unions come across as nothing more than the ability for the church to control more of and keep an eye on the congregation’s purse strings to make sure they are getting their cut. This is problematic after reporting two African American banks closed their doors to start 2015, thereby reducing the number of African American banks to twenty-three. A far cry from the 1990s, when there were over fifty African American owned banks.
African American churches are also siphoning off much needed capital from other institutions within the community where capital is vitally needed. Recently, an example of this was shared by Jarrett Carter, Sr. in an editorial for HBCU Digest where he shared, “Last year, I gave more than $10,000 to my church, $1,500 to Alpha Phi Alpha Fraternity Inc., and $150 dollars to my alma mater.” In a 1987 study by Emmett Carson for Joint Center for Political Studies reported, “Over two-thirds (68 percent) of all dollars that are contributed by blacks to charity go to the church.” A figure at the time that was higher than the national average of 46.9 percent. It is hard to imagine that although the study is almost thirty years old that much has changed given the disclosure by Mr. Carter. Some may argue that it has in fact gotten worse. Unfortunately, such a disproportionate amount being given to churches with our limited income leaves little for investment in the rest of African America’s institutions. Over the past 100 years African American owned hospitals have decreased from 500 to 1, African American boarding schools have decreased from 100 to 4, the institutional gap in HWCU/HBCU endowments has grown from 46:1 to 106:1 over the past 20 years, HWCU/HBCU research expenditures gap is 30:1, Harlem and countless other African American communities have been gentrified, and the wealth gap among all other groups (except Native Americans) and African Americans continues to severely widen. Yet, the African American church continues to be a booming industry. As a result we see even the African American non-religous based credit unions and banks anchoring their “business” products to churches.
Let me be clear, I am not against the African American church. It has been a vital institution in our community. Its history and place in our communities is important, but it can not and should not be asked to solve all of our problems. A religious institution is there to be part of our community’s social institutional fabric, but it is not there to enrich and strengthen us economically or politically. Each institution in a community has a purpose and function. None more important than the other and all are needed. The acute investment that African America has put into its churches though has created a situation where all others starve and this has created an ongoing crisis that is on the brink of disaster. Church based credit unions are not setup to make small business loans, which are vitally needed to created more African American businesses and create jobs in our communities. They are not setup to decide which STEM and humanities research should be given grants that can one day be turned into private application or help shape policy, and nor should they be. That is not what their purpose is or ever was intended to be.

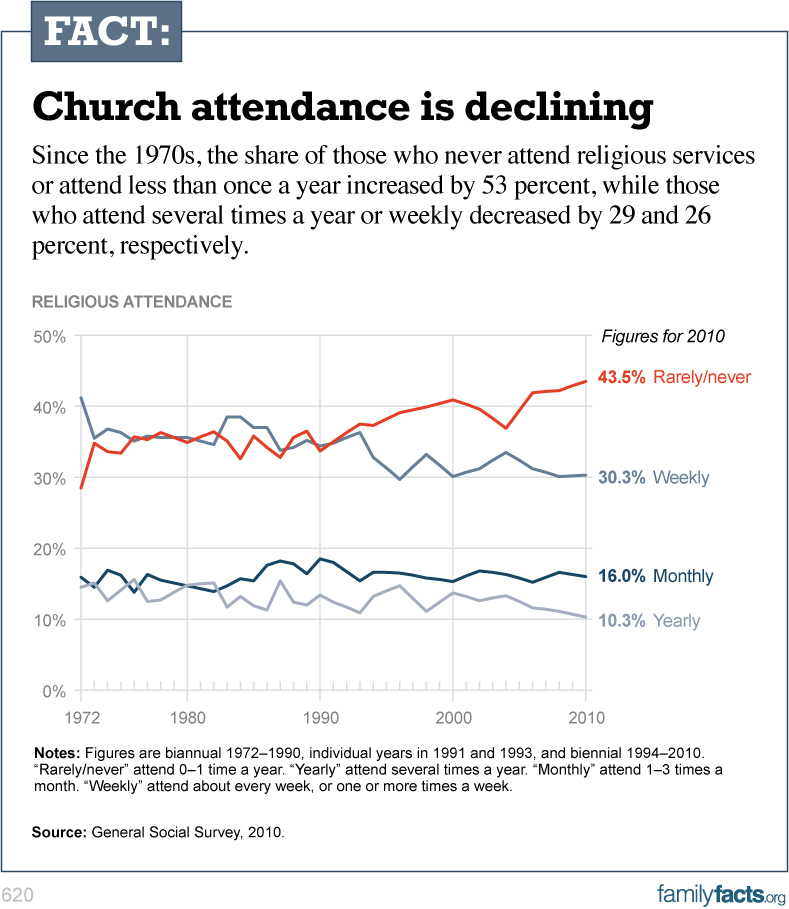
Overall, church attendance in America is declining (above) and has been for the past sixty years, and as is often the case we are behind the curve of change. This despite African American men and Millennials being one of the fastest declining groups in church attendance. African American men are almost twice as likely as African American women to not attend church. Financially, this is not so much of an issue for the church, since African American women lead virtually in every economic category. African America is the only group where the women outnumber the men in employment and are predominantly head of households. The irony if there is any, is that the vast majority of African American churches are still headed by men, but that is another article for another time. African American women hold the proverbial purse strings and they are in the church.
If African America is to ever progress economically, then it needs a lesson in portfolio diversification also known as do not put all your eggs in one basket, one stock, or one institution. Right now, we are overweight in church “stock”. For which I can already hear the rebuttal of, “You can never be to overweight in the Lord!”, but I did not say overweight in your spirituality. I said overweight in the church, and one does not beget the other despite how much we try to convince ourselves otherwise. In an interview on HBCU Digest by the aforementioned Jarrett Carter, I was asked if African America was culturally adverse to economies of scale and I believed then and I believe now that the answer is a resounding no. However, I also remember hearing Tavis Smiley speak once and he said there is a difference between hope and optimism. Hope much like faith does not have to be grounded in anything, but optimism has to be grounded in facts that show a favorable trend. I am hoping for some reason to be optimistic about our economic progress soon, but that will not happen until we decrease what we give and expect from our churches and increase investment into our other institutions, like our banks and credit unions, that are built to serve the purpose of our economic progress. I better pray.