
“When an African American earns $1.00 with our labor, there is an owner that earns $1.20 in operating income from ownership of the vessel and they get to count said vessel as an asset. This means when we do not work for firms from our own community, then the bulk benefit of our talents are still rewarding Others. That reality does not change whether we are earning $80,000 or $8 million. Individual talents are always building up institutional wealth, the question is for our own community or someone else’s.” – William A. Foster, IV
A river does not ask where its water goes. It simply runs, cutting canyons, carrying silt, turning turbines wherever the engineers have built them. For a hundred years, a river ran through a valley and lit every town along its banks, except the town it rose from. That town kept its lanterns. It sent its water downstream and called the arrangement progress, because the workers who built the dam drew a wage, and a wage, everyone insisted, was the same as owning the river. It was not until the town tried to build its own turbine that it discovered the difference: a wage ends when the shift ends. A turbine keeps generating current long after the worker who built it has gone home.
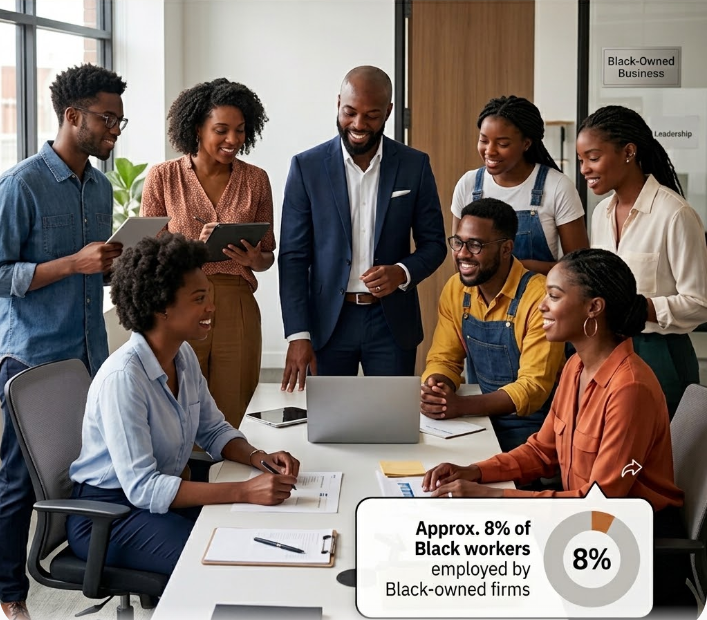
That difference between generating value and owning the mechanism that captures it is the entire story embedded in a figure from Pew Research Center’s analysis of federal business data that ought to stop every Black economist and institution builder in their tracks: Black-owned employer firms in the United States employed roughly 1.6 million workers in 2022, with annual payrolls estimated at $61.2 billion, according to Pew’s review of Census Bureau survey data. Set against the more than 20 million Black Americans in the labor force, that 1.6 million figure is not a success statistic. It is a containment statistic. No group in America works less for itself than African Americans and not because Black workers labor any less than anyone else, but because so little of what that labor builds accrues to institutions Black America actually owns. The river runs. The valley stays dark.
The economist Claud Anderson gave this dynamic its plainest possible name three decades ago in Black Labor, White Wealth: The Search for Power and Economic Justice, arguing that American wealth was built substantially on Black labor under slavery and Jim Crow and has been sustained since through policy and practice that keeps that labor’s output flowing into someone else’s balance sheet rather than its own. Anderson’s proposed remedy, which he later formalized through his organization, the PowerNomics Corporation of America, was not a moral appeal either it was a group-economics strategy aimed squarely at ownership and capital control rather than participation and goodwill. The employment and ownership figures that follow are the modern receipts for exactly the imbalance Anderson named in 1994, updated with three additional decades of federal data that show the imbalance persisting in remarkably precise form.
This is not a moral argument. It is a capacity argument, and the distinction matters, because HBCU Money has never found the moral case persuasive to the people who control capital allocation, and neither should we expect it to be. The self-interest case is the only one that survives contact with a boardroom: an ecosystem that does not own the firms employing its own labor cannot retain the capital that labor generates, cannot direct where that capital gets reinvested, and cannot build the institutional density required to negotiate as a bloc rather than beg as individuals. Ownership is not a symbolic preference. It is the only mechanism by which labor output converts into compounding capital instead of a paycheck that clears and disappears.
Start with the scale problem, because it is worse than the employment figure alone suggests, and it is worse specifically relative to every other ownership group tracked by the federal government. According to the U.S. Census Bureau’s most recent release on business owner characteristics, Black or African American-owned firms account for 3.4% of U.S. employer businesses, up from 2.7% just two years earlier per Brookings’ analysis of the Annual Business Survey — real movement, but movement from a base so small it barely changes the fundamental picture. Put the ownership share next to the population share and the comparison sharpens considerably: Brookings researchers Andre Perry, Manann Donoghoe, and Hannah Stephens found that in 2021, white Americans owned 82% of employer businesses while representing 72.5% of the population, its ownership exceeding population share by nearly ten points. Asian Americans owned 10.9% of employer businesses against a 6.3% population share — again, ownership exceeding population. Black Americans owned 2.7% of employer businesses against a 14.4% population share, and Hispanic or Latino Americans owned 6.9% against a 19.1% population share, both groups locked well below proportional representation, with Black America carrying the widest gap of any racial category Brookings measured. That is not a rounding error. It is a four-to-one to five-to-one density gap between population share and ownership share depending on which year you measure, and it is the single most important number in this entire conversation, because density is what everything else depends on.
The size distribution inside that 3.4% makes the containment tighter still, and here the comparison across ownership groups is unusually clean because the federal data measures the same thing the same way for everyone: what share of each group’s businesses employ nobody at all. Per the same Brookings analysis of Census sole-proprietorship data, Black-owned businesses are the most concentrated of any racial group at that zero-employee scale where 96.3% are sole proprietorships with no paid staff, compared with 92.4% for both Hispanic/Latino-owned and Native American-owned firms, and 81.1% for white-owned firms and 80.1% for Asian American-owned firms. Run the comparison from the employer side and, per Pew’s analysis, it holds just as tightly: about seven-in-ten Black-owned employer firms had between one and nine employees in 2022, a concentration at the smallest possible operating scale that leaves the ownership tier structurally unable to absorb meaningful shares of the available Black labor force even if every one of those firms doubled tomorrow.
The dollar-value version of the same gap is, if anything, more damning, because it isn’t about headcount at all, it’s about what each firm is actually worth once it exists. Using the Census Bureau’s most recent figures, white-owned employer firms generated roughly $17.0 trillion in combined receipts across 4.8 million firms, an average of about $3.5 million in receipts per firm. Black-owned employer firms generated $249.0 billion in combined receipts across 201,000 firms, an average of roughly $1.2 million in receipts per firm, meaning the typical white-owned firm generates nearly three times the revenue of the typical Black-owned firm. Asian-owned firms averaged about $1.75 million per firm and Hispanic-owned firms about $1.47 million, both ahead of the Black-owned average as well.
Two further measurements explain why that revenue gap exists rather than merely documenting that it does, and both point to the same conclusion Anderson reached in 1994: the constraint is access, not capacity. The first is sector composition. Per Pew’s sector breakdown, Black-owned employer firms are concentrated in health care and social assistance (26% of all Black-owned firms), professional and scientific services (14%), transportation and warehousing (9%), administrative and waste management services (8%), and retail and food service (7% each) — sectors that require comparatively little startup capital and generate correspondingly modest revenue per firm. Black ownership is nearly absent from the industries that produce the highest revenue per firm precisely because those industries — utilities, wholesale trade, heavy manufacturing — demand the largest upfront capitalization to enter at all; Brookings researchers note that a 2018 federal survey recorded a total of just 18 Black-owned businesses nationally in the entire utilities sector. Economist Robert Fairlie’s research for the National Bureau of Economic Research finds the same pattern from a different angle: roughly 18% of Black workers are employed in innovation-intensive industries compared with 22% of white workers, and even among Black workers already employed inside them, only about 9% go on to own a business in that industry compared with roughly 14% of white workers in the same position. Tellingly, a study by the Initiative for a Competitive Inner City found that where Black-owned manufacturers do exist inside tracked supply chains, they are on average larger than the white-owned manufacturers in those same chains, the clearest available evidence that this is a barrier to entry, not a deficit of competence, ambition, or business acumen.
The second measurement is the investor class itself, and here the gap dwarfs everything discussed so far. Per Crunchbase data, Black-founded startups received roughly 0.4% of all U.S. venture capital in 2024, down from a 2021 peak of 1.3%, and according to HBCUvc’s quarterly funding tracking, only 17% of Black-founded deals that do get funded reach a Series A round, compared with 37.7% of funded deals overall meaning the small number of Black-founded firms that clear the first hurdle are roughly half as likely to clear the second one. The lending side of the ledger shows the identical pattern in a different market: the Federal Reserve’s Small Business Credit Survey finds Black-owned firms denied credit at roughly 39%, more than double the 18% denial rate for white-owned firms, and a 2021 Federal Reserve Bank of New York report found Black-owned firms independently rated low credit risk were approved for full financing at close to the same rate as high-risk white-owned firms.
But the venture and lending statistics both describe capital that a firm is applying for from someone else. The layer underneath both of them is capital a founder never has to apply for at all, because it comes from their own household or their own network before any bank or investor is ever approached and this is where the wealth gap already documented in this piece does its most permanent damage. According to Google for Startups’ own reporting on the pre-seed funding gap, the average U.S. startup launches on a friends-and-family round of $100,000 to $150,000, drawn from founders’ personal savings and the people closest to them; for Black founders, that figure averages closer to $35,000. Measured on a liquid-wealth basis stripping out home equity, since a house cannot be cashed out to fund a check, a 2023 analysis by Fifth Star Funds put the white-to-Black wealth ratio at roughly twenty-two-to-one, meaning a Black founder trying to raise a typical $23,000 friends-and-family round would need to draw on the entire liquid wealth of six Black families to do it. A firm that cannot clear this round never reaches the point of being denied a bank loan or passed over by a fund; it simply launches undercapitalized, if it launches at all, and stays capped near sole-proprietor scale for the rest of its life which is a large part of why it stays there. The historical contrast needs no editorializing: Bloomberg’s reporting on Amazon’s founding, later summarized by Newser, found Amazon’s 1995 seed round included $245,573 personally invested by Jeff Bezos’s own parents, Jackie and Mike Bezos. And per multiple retellings of Google’s founding, including Celebrity Net Worth’s account of its earliest investors, Google’s first outside money, three years later, arrived as $100,000 personal checks from Stanford computer science professor David Cheriton and Sun Microsystems co-founder Andy Bechtolsheim, written before the company was even legally incorporated, followed within weeks by a $250,000 personal investment from Bezos himself. No institution of any kind was involved in either case. The capital that mattered most was already sitting in a family’s bank account.
The handful of Black-led investment vehicles that do exist compound this problem rather than solve it, and the reason is worth stating plainly rather than glossing over: Black households cannot yet supply enough investable wealth to anchor those funds as limited partners, and Black institutions — banks, credit unions, HBCU endowments, pension-adjacent capital pools — are not yet large enough collectively to do it either. A Black general partner running a fund capitalized primarily by Others’ foundations, endowments, and pension systems has changed who makes the investment decisions without changing who ultimately owns the return, which means fund formation at the top of the capital stack and household wealth at the bottom of it are not two separate problems. They are the same institutional density gap, expressed at two different altitudes.
Five separate measurements now point at the same wall: Black-owned firms are underrepresented in raw count relative to population, overrepresented at the smallest employee-size tier, smaller in average dollar value, concentrated in the lowest-capital sectors, and shut out of the personal, venture, and institutional capital that would move a firm generating $1.2 million in revenue toward the $3.5 million white-owned average. Five measurements, one underlying constraint.
The historical context here is not ancient, and it runs on two tracks that arrive at the same conclusion from different directions. Where Anderson traced the mechanism backward through slavery and Jim Crow policy, the sociologist Thomas Shapiro traced it forward through household balance sheets a decade later, arguing in The Hidden Cost of Being African American that income and wealth are not the same variable, and that the persistence of racial inequality runs through the asset side of the ledger rather than the wage side. Employment, even full employment, even rising Black employment, does not close a wealth gap if the employer capturing the surplus value of that labor sits outside the community. This is precisely why the Federal Reserve’s Survey of Consumer Finances, as analyzed by the National Community Reinvestment Coalition, shows the gap widening in dollar terms even as it narrows in percentage terms: median Black household wealth rose from roughly $28,000 to $44,900 between 2019 and 2022, but median wealth overall rose enough that the absolute gap between Black and white households actually grew by nearly $50,000 over the same period. By 2022, the median white household held $284,310, more than six times the $44,100 held by the median Black household. Labor income is necessary. It has never been sufficient. A wage is a flow; a firm is a stock. You cannot out-earn a four-to-one ownership density gap through salary alone, no matter how many Black workers show up for shifts at other people’s companies.
There is a growth signal worth taking seriously here, and HBCU Money should not undersell it even while insisting the baseline remains inadequate. Per Census Bureau data reported by Governing, the number of Black-owned employer businesses grew nearly 57% between 2017 and 2022, and Black-owned firms accounted for more than half of all new employer businesses started nationally in that period. In the most recent year-over-year comparison available across all racial groups, Brookings found Black-owned employer businesses posted the largest percentage increases in employee count, revenue, and payroll of any group tracked employee growth of 7%, revenue growth of 30%, and payroll growth of 27%, each figure running 5 to 10 percentage points ahead of white, Asian American, and Hispanic firms over the same year. Formation is not the same as capacity, however, and the arithmetic of closing a base this small is unforgiving: Brookings analysts estimate it would take roughly 700,000 additional Black-owned employer firms to bring ownership into line with Black population share, representing an estimated $800 billion in additional revenue and 6 million additional jobs and that at the pace of the single best growth year on record, full parity remains roughly 100 years away.
The strategic implications follow directly from the density problem, and this is where the four throughlines this publication returns to — institutional density, capital retention, talent concentration, and strategic coordination — stop being abstractions and start functioning as a diagnostic. Institutional density is the root constraint: 201,000 Black-owned employer firms against 5.9 million total U.S. employer firms, per the Census Bureau, means the ecosystem simply does not have enough vessels to hold its own labor, and those vessels that do exist are smaller both in headcount and in revenue than their counterparts in every other ownership category and are locked, disproportionately, into the sectors and financing markets least able to change that. Capital retention fails as a direct downstream consequence. Talent concentration is the third casualty: the most capable Black managers, engineers, and operators in the country are overwhelmingly employed inside institutions Black America does not control. And strategic coordination; the ability to move Black labor, Black capital, and Black institutional leadership as a single directed force, precisely the coordination Anderson’s PowerNomics called for cannot exist at scale when the typical Black-owned firm is roughly a third the revenue size of the typical white-owned firm, is concentrated outside the industries capable of scaling, has almost no access to personal, venture, or institutional growth capital, and when 92 of every 100 Black workers punch in somewhere the community has no ownership stake in the firm.
This is where the banking and credit union infrastructure this publication tracks obsessively becomes the actual lever, not a side note though it is now clear that lever needs a second one built alongside it. According to HBCU Money’s own 2025 African American-Owned Bank Directory and African American-Owned Credit Union Directory, there are 17 African American-owned banks in the country holding roughly $6.72 billion in combined assets, and 205 African American-owned credit unions holding roughly $8.15 billion across nearly 727,000 members, a combined $15 billion in institutional balance sheet capacity sitting underneath a labor force generating tens of billions in annual wages that mostly clears through mainstream white-owned lenders instead. Only a small fraction of HBCUs and PBIs themselves bank with African American-owned institutions, per that same directory data, a fact that should embarrass every finance department at every one of the 100 plus federally designated HBCUs and PBIs. But deposit infrastructure alone cannot close the sector-composition gap, the friends-and-family gap, or the institutional-capital gap, those require a growth-equity layer this ecosystem still largely lacks, and building it will require Black institutional balance sheets to grow enough to anchor it themselves, not simply put a Black name on someone else’s money.
Business schools at institutions like Fort Valley State, Chicago State, Grambling, and Norfolk State are training a pipeline of Black finance, accounting, and management talent every year, talent that overwhelmingly gets absorbed into the same non-Black employer base generating the 1.6 million versus 20 million imbalance Pew’s data documents in the first place. The concrete institutional solution is not a slogan about entrepreneurship; it’s coordination between four things that currently operate as strangers to each other: the HBCU business school pipeline producing operators, the $15 billion Black bank and credit union balance sheet capacity that can underwrite working capital, an equity and growth-capital layer purpose-built and Black-capitalized to move firms out of the lowest-capital sectors and into the high-revenue ones currently closed to them, and the roughly 200,000 existing Black-owned employer firms that need all three of those pieces to grow past the headcount ceiling, the revenue ceiling, and the sector ceiling that currently trap the median firm below every comparable ownership group.
The employment share figure — 1.6 million out of a labor force many multiples that size — is not a statistic to mourn. It is a target with a number attached, and the comparative data makes the target legible in five dimensions at once: more firms, larger firms, firms worth more per dollar of revenue, firms operating in higher-capital sectors, and firms with actual access to the capital — personal, venture, and institutional — that funds growth. Anderson named this arrangement in 1994. The federal government has spent every year since generating the receipts that prove him right. No group works less for itself than African Americans; not for lack of labor, and not for lack of the firms willing to try, but for lack of the sectors, the capital, and the institutions built to keep that labor’s output at home.
Disclaimer: This article was assisted by ClaudeAI.

