Analysis: Asian Americans were the only group to see an increase in their unemployment rate from October with a 40 basis point increase. European and Latino American both had decreases in their unemployment rate with a 20 basis point decrease for both groups from October.
AFRICAN AMERICAN UNEMPLOYMENT RATE BY GENDER & AGE
AFRICAN AMERICAN MEN: 6.4%
AFRICAN AMERICAN WOMEN: 4.8%
AFRICAN AMERICAN TEENAGERS: 12.2%
AFRICAN AMERICAN PARTICIPATION BY GENDER & AGE
AFRICAN AMERICAN MEN: 69.2%
AFRICAN AMERICAN WOMEN: 63.6%
AFRICAN AMERICAN TEENAGERS: 31.6%
Analysis: African American Men and Women saw an increase and decrease in their unemployment rates by 110 and 50 basis points, respectively. African American Men saw a 170 basis point increase in their participation rate from October while African American Women had a 10 basis point decrease in their participation rate from October. African American Teenagers remain an extremely volatile group with their unemployment rate plummet by 660 basis points, but also seeing their participation rate increase by 60 basis points.
African American Men-Women Job Gap: African American Women currently have 890,000 more jobs than African American Men in November. This is a decrease from 970,000 in October.
CONCLUSION: The overall economy added 199,000 jobs in November while African America gained 264,000 jobs. From CNBC, “The data first raised concerns that the economy was running too hot for inflation to cool enough for the Fed to start retreating from its high-rates policy. Some traders expect the Fed to start cutting rates as early as next spring, with its latest policy meeting set for Wednesday.”
At the end of 2022, African America had asset values totaling $6.2 trillion and liability values totaling $1.5 trillion. Below is a breakdown of those by wealth component by assets and liabilities as reported by the Federal Reserve’s Distribution of Household Wealth data. African American assets amounted to 5% of U.S. Household assets and African American liabilities amounted to 8.8% of U.S. Household liabilities.
HBCU Money took a look at what exactly the African American asset portfolio entailed. African Americans are highly concentrated in two main areas, real estate and retirement accounts (pensions and 401K), respectively. These two groups comprise almost 70 percent of African American assets versus only 43 percent for European Americans. Corporate equities/mutual funds and private business ownership comprise a staggering 35.1 percent of European American assets versus only 9.6 percent for African Americans, these two categories also representing African America’s lowest asset holdings.
Examining where African America puts its money and theorizing why can give us insight into strategies that can help in closing both household and institutional wealth gaps.
ASSETS
Real estate – $2.15 trillion
Definition: Real estate is defined as the land and any permanent structures, like a home, or improvements attached to the land, whether natural or man-made.
% of African America’s Assets – 33.1%
% of U.S. Household Real Estate Assets – 6.1%
10 Year % Growth – 187%
Consumer durable goods – $550 billion
Definition: Consumer durables, also known as durable goods, are a category of consumer goods that do not wear out quickly and therefore do not have to be purchased frequently. They are part of core retail sales data and are considered durable because they last for at least three years, as the U.S. Department of Commerce defines. Examples include large and small appliances, consumer electronics, furniture, and furnishings.
% of African America’s Assets – 7.2%
% of U.S. Household Assets – 7.3%
10 Year % Growth – 81%
Corporate equities and mutual fund shares – $270 billion
Definition: A stock, also known as equity, is a security that represents the ownership of a fraction of the issuing corporation. Units of stock are called “shares” which entitles the owner to a proportion of the corporation’s assets and profits equal to how much stock they own. A mutual fund is a pooled collection of assets that invests in stocks, bonds, and other securities.
% of African America’s Assets – 4.9%
% of U.S. Household Assets – 1.1%
10 Year % Growth – 90%
Defined benefit pension entitlements – $1.57 trillion
Definition: Defined-benefit plans provide eligible employees with guaranteed income for life when they retire. Employers guarantee a specific retirement benefit amount for each participant based on factors such as the employee’s salary and years of service.
% of African America’s Assets – 24.7%
% of U.S. Household Assets – 10.5%
10 Year % Growth – 51%
Defined contribution pension entitlements – $600 billion
Definition: Defined-contribution plans are funded primarily by the employee. The most common type of defined-contribution plan is a 401(k). Participants can elect to defer a portion of their gross salary via a pre-tax payroll deduction. The company may match the contribution if it chooses, up to a limit it sets.
% of African America’s Assets – 11.8%
% of U.S. Household Assets – 8.0%
10 Year % Growth – 163%
Private businesses – $350 billion
Definition: A private company is a firm held under private ownership. Private companies may issue stock and have shareholders, but their shares do not trade on public exchanges and are not issued through an initial public offering (IPO). As a result, private firms do not need to meet the Securities and Exchange Commission’s (SEC) strict filing requirements for public companies.1 In general, the shares of these businesses are less liquid, and their valuations are more difficult to determine.
% of African America’s Assets – 4.7%
% of U.S. Household Assets – 2.2%
10 Year % Growth – 106%
Other assets – $700 billion
Definition: Alternative investments can include private equity or venture capital, hedge funds, managed futures, art and antiques, commodities, and derivatives contracts.
% of African America’s Assets – 13.6%
% of U.S. Household Assets – 4.2%
10 Year % Growth – 136%
LIABILITIES
Home Mortgages– $770 billion
Definition: Debt secured by either a mortgage or deed of trust on real property, such as a house and land. Foreclosure and sale of the property is a remedy available to the lender. Mortgage debt is a debt that was voluntarily incurred by the owner of the property, either for purchase of the property or at a later point, such as with a home equity line of credit.
% of African America’s Liabilities – 56.1%
% of U.S. Household Liabilities – 7.2%
10 Year % Growth – 53.3%
Consumer Credit – $710 billion
Definition: Consumer credit, or consumer debt, is personal debt taken on to purchase goods and services. Although any type of personal loan could be labeled consumer credit, the term is more often used to describe unsecured debt of smaller amounts. A credit card is one type of consumer credit in finance, but a mortgage is not considered consumer credit because it is backed with the property as collateral.
% of African America’s Liabilities – 42.1%
% of U.S. Household Liabilities – 14.1%
10 Year % Growth – 91.7%
Other Liabilities – $30 billion
Definition: For most households, liabilities will include taxes due, bills that must be paid, rent or mortgage payments, loan interest and principal due, and so on. If you are pre-paid for performing work or a service, the work owed may also be construed as a liability.
“With segregation, with the isolation of the injured and the robbed, comes the concentration of disadvantage. An unsegregated America might see poverty, and all its effects, spread across the country with no particular bias toward skin color. Instead, the concentration of poverty has been paired with a concentration of melanin.” – Ta-Nehisi Coates
HBCUs and PBIs are arguably African American institutions that are built to solve and protect African American interests. There is no greater crisis that currently faces African American economically than its poverty. Its impact across all statistics like health outcomes, civic participation, business creation, student loan debt, and the list goes on and on. What exactly HBCUs and PBIs are doing about African American poverty in their cities and states is complicated to address. Many would say that simply graduating the number of African Americans with degrees is more than enough. That is until you realize the depth and impact our counterparts are using their higher educational institutions to do. MIT has an incubator that allows students to create companies while matriculating. Schools like Stanford have helped create Google, Harvard is the birthplace of Facebook, University of Texas and Texas A&M formed UTIMCO to create the nation’s largest endowment, and much more. PWIs banking with banks like J.P. Morgan, Wells Fargo, and others ensuring that European American owned banks have a deposit base that allows them to conduct the business of financially protecting their community and lending for European American homeownership and small business creation. HBCUs, not so much. It is also not just the HBCUs, but HBCU foundations, HBCU alumni associations, and other organizations that are supposed to be part of the vanguard/ecosystem of African American institutional development that pulls African American individuals, families, and communities away from poverty in conjunction with other African American institutions.
Poverty is already a complex and layered system and African American poverty is that on steroids. Each state and the HBCU/PBIs institutional system in it are part of the counterattack against African American poverty. Or at least we want them to be. For the alumni and administrations who see their institutional system as part of the empowerment and pulling of African America out of the throws of poverty it requires to know the actual depths of the situation.
Among the U.S. states with the highest poverty rates for 2022, HBCU/PBI states constituted 8 out of the top 10 for overall poverty.
ALABAMA
Overall Poverty (2020): 15.5%
Overall Poverty (2015): 19.3%
African American Poverty (2020): 23.5%
African American Poverty (2015): 31.1%
Change In African American Poverty 2015-2020: Decreased 24.4%
ARKANSAS
Overall Poverty (2020): 16.2%
Overall Poverty (2015): 18.9%
African American Poverty (2020): 27.1%*
African American Poverty (2015): 33.2%*
Change In African American Poverty 2015-2020: Decreased 18.4%
CALIFORNIA
Overall Poverty (2020): 11.8%
Overall Poverty (2015): 16.5%
African American Poverty (2020): 19.0%*
African American Poverty (2015): 25.4%*
Change In African American Poverty 2015-2020: Decreased 25.2%
DELAWARE
Overall Poverty (2020): 11.3%
Overall Poverty (2015): 12.5%
African American Poverty (2020): 17.3%
African American Poverty (2015): 19.9%
Change In African American Poverty 2015-2020: Decreased 13.1%
DISTRICT OF COLUMBIA
Overall Poverty (2020): 13.5%
Overall Poverty (2015): 17.7%
African American Poverty (2020): 21.6%*
African American Poverty (2015): 25.9%*
Change In African American Poverty 2015-2020: Decreased 16.6%
FLORIDA
Overall Poverty (2020): 12.7%
Overall Poverty (2015): 16.5%
African American Poverty (2020): 19.8%*
African American Poverty (2015): 26.9%*
Change In African American Poverty 2015-2020: Decreased 26.4%
GEORGIA
Overall Poverty (2020): 13.3%
Overall Poverty (2015): 18.3%
African American Poverty (2020): 18.8%
African American Poverty (2015): 27.0%
Change In African American Poverty 2015-2020: Decreased 30.1%
ILLINOIS
Overall Poverty (2020): 11.5%
Overall Poverty (2015): 14.4%
African American Poverty (2020): 24.2%*
African American Poverty (2015): 30.6%*
Change In African American Poverty 2015-2020: Decreased 20.9%
KENTUCKY
Overall Poverty (2020): 16.3%
Overall Poverty (2015): 19.1%
African American Poverty (2020): 24.4%*
African American Poverty (2015): 32.4%
Change In African American Poverty 2015-2020: Decreased 24.7%
LOUISIANA
Overall Poverty (2020): 19.0%
Overall Poverty (2015): 19.8%
African American Poverty (2020): 29.4%*
African American Poverty (2015): 33.7%*
Change In African American Poverty 2015-2020: Decreased 12.8%
MARYLAND
Overall Poverty (2020): 9.0%
Overall Poverty (2015): 10.1%
African American Poverty (2020): 12.9%
African American Poverty (2015): 14.6%*
Change In African American Poverty 2015-2020: Decreased 11.6%
MASSACHUSETTS
Overall Poverty (2020): 9.4%
Overall Poverty (2015): 11.6%
African American Poverty (2020): 17.6%
African American Poverty (2015): 21.8%
Change In African American Poverty 2015-2020: Decreased 19.3%
MICHIGAN
Overall Poverty (2020): 13.0%
Overall Poverty (2015): 16.2%
African American Poverty (2020): 25.9%*
African American Poverty (2015): 33.0%*
Change In African American Poverty 2015-2020: Decreased 21.5%
MISSISSIPPI
Overall Poverty (2020): 19.6%
Overall Poverty (2015): 21.5%
African American Poverty (2020): 30.7%
African American Poverty (2015): 34.3%*
Change In African American Poverty 2015-2020: Decreased 10.5%
MISSOURI
Overall Poverty (2020): 12.9%
Overall Poverty (2015): 15.5%
African American Poverty (2020): 21.2%
African American Poverty (2015): 28.1%*
Change In African American Poverty 2015-2020: Decreased 24.6%
NEW YORK
Overall Poverty (2020): 13.0%
Overall Poverty (2015): 15.9%
African American Poverty (2020): 20.0%
African American Poverty (2015): 23.2%
Change In African American Poverty 2015-2020: Decreased 13.8%
NORTH CAROLINA
Overall Poverty (2020): 13.6%
Overall Poverty (2015): 17.2%
African American Poverty (2020): 21.5%
African American Poverty (2015): 26.5%
Change In African American Poverty 2015-2020: Decreased 18.9%
OHIO
Overall Poverty (2020): 13.1%
Overall Poverty (2015): 15.8%
African American Poverty (2020): 27.3%*
African American Poverty (2015): 34.7%*
Change In African American Poverty 2015-2020: Decreased 21.3%
OKLAHOMA
Overall Poverty (2020): 15.2%
Overall Poverty (2015): 16.6%
African American Poverty (2020): 28.2%*
African American Poverty (2015): 29.9%*
Change In African American Poverty 2015-2020: Decreased 5.7%
PENNSYLVANIA
Overall Poverty (2020): 12.0%
Overall Poverty (2015): 13.6%
African American Poverty (2020): 24.9%
African American Poverty (2015): 29.5%
Change In African American Poverty 2015-2020: Decreased 15.6%
SOUTH CAROLINA
Overall Poverty (2020): 13.8%
Overall Poverty (2015): 16.8%
African American Poverty (2020): 23.1%*
African American Poverty (2015): 26.0%
Change In African American Poverty 2015-2020: Decreased 11.2%
TENNESSEE
Overall Poverty (2020): 13.9%
Overall Poverty (2015): 18.3%
African American Poverty (2020): 21.5%
African American Poverty (2015): 30.9%
Change In African American Poverty 2015-2020: Decreased 30.4%
TEXAS
Overall Poverty (2020): 13.6%
Overall Poverty (2015): 17.2%
African American Poverty (2020): 18.6%
African American Poverty (2015): 23.2%
Change In African American Poverty 2015-2020: Decreased 19.8%
VIRGINIA
Overall Poverty (2020): 9.9%
Overall Poverty (2015): 11.8%
African American Poverty (2020): 16.4%*
African American Poverty (2015): 21.2%*
Change In African American Poverty 2015-2020: Decreased 22.6%
*Denotes that African Americans had the highest poverty rate among all groups during that period.
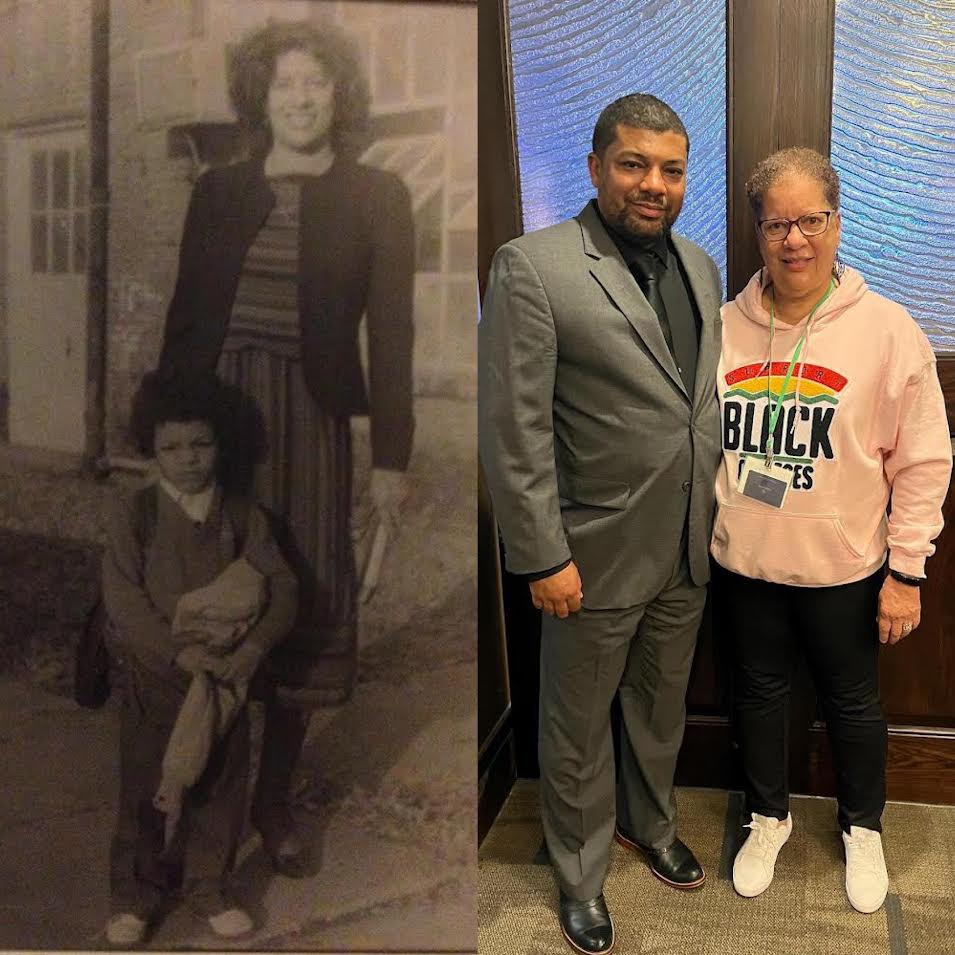
My mother was the making of me. She was so true, so sure of me; and I felt I had something to live for, someone I must not disappoint. – Thomas Edison
By William A. Foster, IV
If you asked my mother, Dr. Laurette Foster, to be honest, she is tired of hearing me talk about economics, finance, African American institutions, and HBCU endowments. For well over twenty plus years, I would probably say most of my family is tired of me talking about these subjects. My baby sister, Dr. Aysha (Foster) Williams, often says I can take a conversation about the weather and turn it into a conversation around money. I will admit there is a joy that I get from combing through economic and financial data and building excel spreadsheets that leave many scratching their head.
It is also my studies in institutional development on the graduate level at Prairie View A&M under the guidance of Dr. Rick Baldwin and Dr. Akel Kahera that helped shape the economics and finance training I had many years ago at Virginia State University. But the foundational HBCU professor I had was my mother Dr. Foster, whom I have often referred to as the real life version of Claire Huxtable, who even while I was in elementary school had me working on college algebra problems while we waited in the lobby of my sister’s ballet class to finish. Any time my sister and I were not in school we were on the campus of Prairie View A&M University from elementary through high school. On visits to my grandmother in Petersburg, Virginia during the summer or holidays we would spend copious amounts of time on the campus of Virginia State University. To say we were nourished by professors and staff at every turn culturally and academically during our childhood would be an understatement. Many professors simply became extended aunts and uncles as it were. The profound impact has carried with me my entire life and always will. It is shaping that I yearn for so many other African American children to experience.
Despite this hidden treasure trove of intellect and cultural nourishment, HBCU professors are for many African Americans a place that often despite being underpaid, under resourced, and overworked the hope for so many African American students who matriculate through HBCU grounds in hopes of a better future for themselves, their families, and their communities. No pressure at all. It is these professors that for many will be the first time they will have encountered an African American with an advanced degree. Again, no pressure. However, the pressure does not faze many who simply wish they had the resources to do more. A scarcity that is unfortunately indicative of African America institutionally as a whole. Doing more with less is a mantra that has been pervasive in our community for the past seventy years.
The St. Louis Federal Reserve reports that total financial assets held by U.S. 501(c)(3) organizations is an estimated $5.6 trillion. Despite this reality African American nonprofits have another reality, be they academic or otherwise, they very often fail to garner the financial assets necessary to sustain multiple generations leaving community infrastructure constantly vulnerable and often not being able to pass down and institutionalize the rich intellectual capital that has been accumulated. Over half of all African American nonprofits would close their doors with the loss of just a few key donors meaning most have not created sustainable financial models. Rasheeda Childress of The Chronicle of Philanthropy says, “Most (African American nonprofits) operate on razor-thin margins and need more philanthropic support for training in fundraising, leadership, and financial management, a new survey has found.”
Over thirty years ago, while I was still trying to get out of elementary school, an organization was formed called the HBCU Faculty Development Network. Armed with the mission to help empower and enrich the pedagogy legacy of far too many giants of HBCU academia to name here. For the past 10 years my mother has led the organization as its executive director. My mother surrounded by a tenacious board of directors who want to see HBCU professors excel, they have put in countless hours and annual conferences for their HBCU colleagues and helping shape the HBCU future. But like most African American organizations they too were constantly financially vulnerable and the need to evolve and expand their reach and programming was acutely limited by their resources.
A year ago, my mother asked me to come and consult the organization on helping ensure its financial future. I assume she grew tired of being the only one who had to hear me rant constantly about the need for African American institutions to take their finances seriously so they could be sustainable and empowered institutions for our community and decided to subject her fellow colleagues as well. Using the blueprint that was published by HBCU Money a few years earlier titled, ’12 Things Your HBCU Alumni Association/Chapter Needs To Do To Be Financially Successful’, we discussed the endless avenues of revenue available to them that would help them grow. Not least among them, would be the establishment of an endowment which according to the Summer Institute of Finance only 11.2 percent of organizations have – meaning that for African American organizations that percentage is probably a minute number in comparison to the overall although no specific data exist. The board diligent and committed over the course of a few days and sessions we were able to lay the groundwork for what came to be.
At the HBCU Faculty Development Network’s 2023 Annual Conference in Houston, Texas they were finally ready to unveil the hard work. The formation of the endowment was announced to their membership and those in attendance to the conference. My life as an economist and financier that has been built and shaped to support African American institutions is culminated in moments like this. That my mother and all those HBCU professors who cultivated me over the years so that I could bring my experience and expertise to them and ensure that their legacies will live on is truly one of the proudest moments of my life and to be able to share it with my mother makes it truly priceless.
To donate to the HBCU Faculty Development Network’s endowment, click here.
A special thank you as well to the board for trusting the process and embracing this new day.
Dr. Donald Collins, Prairie View A&M University
Dr. Karen Stewart, Texas Southern University
Dr. Ruby Broadway, Dillard University
Dr. China Jenkins, formerly of Texas Southern University
Analysis: African Americans were the only group to see an increase in their unemployment rate from August with a 40 basis point increase. Asian and Latino American both had decreases in their unemployment rate with a 30 basis point decrease for both groups from August.
AFRICAN AMERICAN UNEMPLOYMENT RATE BY GENDER & AGE
African American Men: 5.3%
African American Women: 5.3%
African American Teenagers: 18.8%
AFRICAN AMERICAN PARTICIPATION BY GENDER & AGE
African American Men: 67.5%
African American Women: 63.6%
African American Teenagers: 31.0%
Analysis: African American Men and Women both saw and increase and decrease in their unemployment rates by 60 and 20 basis points, respectively. African American Men saw a 20 basis point increase in their participation rate from August while African American Women had a 10 basis point decrease in their participation rate from August. African American Teenagers remain an extremely volatile group with their unemployment rate skyrocketing by 710 basis points, but also seeing their participation rate increase by 260 basis points. For African American Teenagers both unemployment rate and participation rate are at 5 month highs.
African American Men-Women Job Gap: African American Women currently have 970,000 more jobs than African American Men in October. This is a increase from 739,000 in September.
CONCLUSION: The overall economy added 150,000 jobs in October. African America lost 15,000 jobs in October. From CNN, “Last month’s job gains are the lowest since June, but there is a caveat: The October total reflects a 35,000-job decline in the manufacturing sector, specifically 33,200 jobs lost in the motor vehicles and parts industry. Those declines were largely attributed to strike activity.”