
HBCU Money™ Dozen 7/14 – 7/18

???????????????????????????????????????

Did you miss HBCU Money™ Dozen via Twitter? No worry. We are now putting them on the site for you to visit at your leisure. We have made some changes here at HBCU Money™ Dozen. We are now solely focused on research and central bank articles from the previous week.

Research

10 Top Jobs by Salary for Social Media Pros l CIOonline trib.al/uvfc9TO

There’s almost a million fake apps targeting your phone l CSOonline bit.ly/1stmMjw

Chaos Computer Club bolsters NSA spying complaint with Tor snooping evidence l CSOonline bit.ly/1mY3zTq

24% Renewable Energy Over 27 Years — Is That All?!? l Clean Technica dlvr.it/6LrPM8

The universe is much, much brighter than it should be. Why? l New Scientist ow.ly/zgbkEpic.twitter.com/oO6VbC71uM

Researchers recreate conditions deep inside giant planets l Livermore Lab 1.usa.gov/1tWlWxk

Federal Reserve, Central Banks, & Financial Departments

House Gives Thumbs-Up to Marijuana Banking l Credit Union Journal bit.ly/1jBukhh

What private payroll employment numbers say about the labor market l St. Louis Fed bit.ly/1nprIyd

Social safety nets to protect people from loss of income on the rise among countries in Africa l World Bank wrld.bg/zejE9

New construction starts plummet 9.3% in June l Housing Wire hwi.re/6LsTyd

Teachers: Planning to teach about the Great Depression next school year? l Econ Lowdown bit.ly/1jRLIZI

Adding this one test could cut FHA default rates in half l Housing Wire hwi.re/6LTYzh

Thank you as always for joining us on Saturday for HBCU Money™ Dozen. The 12 most important research and finance articles of the week.

The HBCU Money™ Weekly Market Watch

Our Money Matters /\ July 18, 2014

A weekly snapshot of African American owned public companies and HBCU Money™ tracked African stock exchanges.

NAME TICKER PRICE (GAIN/LOSS %)

African American Publicly Traded Companies

Citizens Bancshares Georgia (CZBS) $8.60 (1.18% UP)

M&F Bancorp (MFBP) $5.13 (0.00% UNCH)

Radio One (ROIA) $4.91 (2.51% UP)

African Stock Exchanges

Bourse Regionale des Valeurs Mobilieres (BRVM)  237.13 (0.45% DN)

Botswana Stock Exchange (BSE)  9 200.56 (0.08% UP)

Ghana Stock Exchange (GSE)  2 332.62 (8.74% UP)*

Nairobi Stock Exchange (NSE)  151.55 (N/A)

Johannesburg Stock Exchange (JSE) 51 695.05 (0.18% DN)

International Stock Exchanges

New York Stock Exchange (NYSE) 10 968.38 (0.72% UP)

London Stock Exchange (LSE)  3 595.97 (0.13% UP)

Tokyo Stock Exchange (TOPIX)  1 263.29 (0.79% DN)

Commodities

Screen Shot 2014-07-18 at 1.20.49 PM

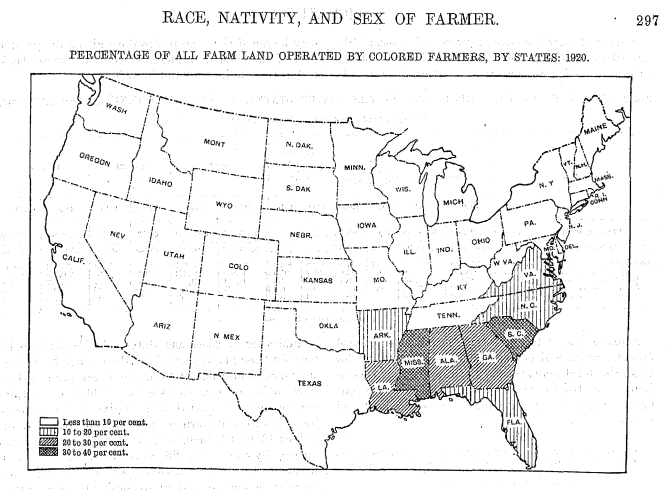
HBCU Money™ Histronomics: 1920 Agricultural Census Of Colored Farms & Land Ownership

Screen Shot 2014-07-12 at 12.25.42 PM

HIGHLIGHTS

  • Total American Farm Acres in 1920 – 956 million acres
  • Economic value of Total American Farm Acres – $66 billion
  • Total Colored Acres in 1920 – 45 million acres
  • Economic value of Total Colored Farm Acres – $2.5 billion
  • % of Total Farm Land Owned by Colored in 1920 – 4.7%
  • Average Colored Farm Acreage in 1920 – 47.3 acres
  • Average Economic Value of African American Farms in 1920 – $2 063

*Colored in the census encompasses African, Native, Japanese, and Chinese Americans. African Americans comprised 97.5% of the colored farm operators in 1920.

Screen Shot 2014-07-12 at 11.58.35 AM

2012’s African American Farm Land Ownership By State

california-farmland--black-and-white-peter-tellone

Farms with a Black or African American Principal Producer

  1. TEXAS – 929,003 acres
  2. MISSISSIPPI – 554,463 acres
  3. ALABAMA – 296,432 acres
  4. OKLAHOMA – 251,680 acres
  5. GEORGIA – 221,290 acres
  6. LOUISIANA – 192,287 acres
  7. SOUTH CAROLINA – 191,452 acres
  8. VIRGINIA – 176,571 acres
  9. NORTH CAROLINA – 152,899 acres
  10. ARKANSAS – 149,530 acres
  11. TENNESSEE – 102,196 acres
  12. FLORIDA – 92,324 acres
  13. NEW MEXICO – 61,300 acres
  14. CALIFORNIA – 32,932 acres
  15. KENTUCKY – 31,483 acres
  16. KANSAS – 29,174 acres
  17. MINNESOTA – 26,193 acres
  18. MISSOURI – 20,107 acres
  19. ILLINOIS – 19,843 acres
  20. OHIO – 11,883 acres
  21. MARYLAND – 10,065 acres
  22. MICHIGAN – 9,525 acres
  23. COLORADO – 7,368 acres
  24. IDAHO – 6,613 acres
  25. NEW YORK – 6,059 acres
  26. WASHINGTON – 5,744 acres
  27. MONTANA – 5,714 acres
  28. INDIANA – 5,704 acres
  29. NEBRASKA – 5,249 acres
  30. WEST VIRGINIA – 3,584 acres
  31. IOWA – 3,332 acres
  32. OREGON – 2,481 acres
  33. NORTH DAKOTA – 2,230 acres
  34. ARIZONA – 1,941 acres
  35. NEW JERSEY – 1,038 acres
  36. MASSACHUSETTS – 983 acres
  37. DELAWARE – 792 acres
  38. VERMONT – 740 acres
  39. MAINE – 363 acres
  40. UTAH – 344 acres
  41. CONNECTICUT – 118 acres
  42. NEW HAMPSHIRE  – 84 acres
  43. HAWAII – (D)
  44. NEVADA – (D)
  45. PENNSYLVANIA – (D)
  46. RHODE ISLAND – (D)
  47. SOUTH DAKOTA – (D)
  48. WISCONSIN – (D)
  49. WYOMING – (D)

Total African American Principal Producer Acres: 3,645,289

Total United States Principal Producer Acres: 914,527,657

African American Percentage: 0.40%

Source: USDA

Unemployment Rate By HBCU State – May 2014

Screen Shot 2014-07-13 at 1.34.22 PM

LOWEST: oklahoma – 4.6%

HIGHEST – kentucky & mississippi – 7.7%

ALABAMA – 6.8%

ARKANSAS – 6.4%

CALIFORNIA – 7.6%

DELAWARE – 5.9%

DISTRICT OF COLUMBIA – 7.5%

FLORIDA – 6.3%

GEORGIA – 7.2%

ILLINOIS – 7.5%

KENTUCKY – 7.7%

LOUISIANA – 4.9%

MARYLAND – 5.6%

MASSACHUSETTS – 5.6%

MICHIGAN – 7.5%

MISSISSIPPI – 7.7%

MISSOURI – 6.6%

NEW YORK – 6.7%

NORTH CAROLINA – 6.4%

OHIO – 5.5%

OKLAHOMA – 4.6%

PENNSYLVANIA – 5.6%

SOUTH CAROLINA – 5.3%

TENNESSEE – 6.4%

TEXAS – 5.1%

VIRGINIA – 5.1%