Tag Archives: black farms

HBCU Money Presents: 2017’s African American Farmers Report

The state of African American farms continues to be a vital component to the African American economy, this despite investment and participation in it on a downward trend. We are highlighting key findings from the 2017 USDA Agriculture Census with 2012 comparison in parentheses where available.

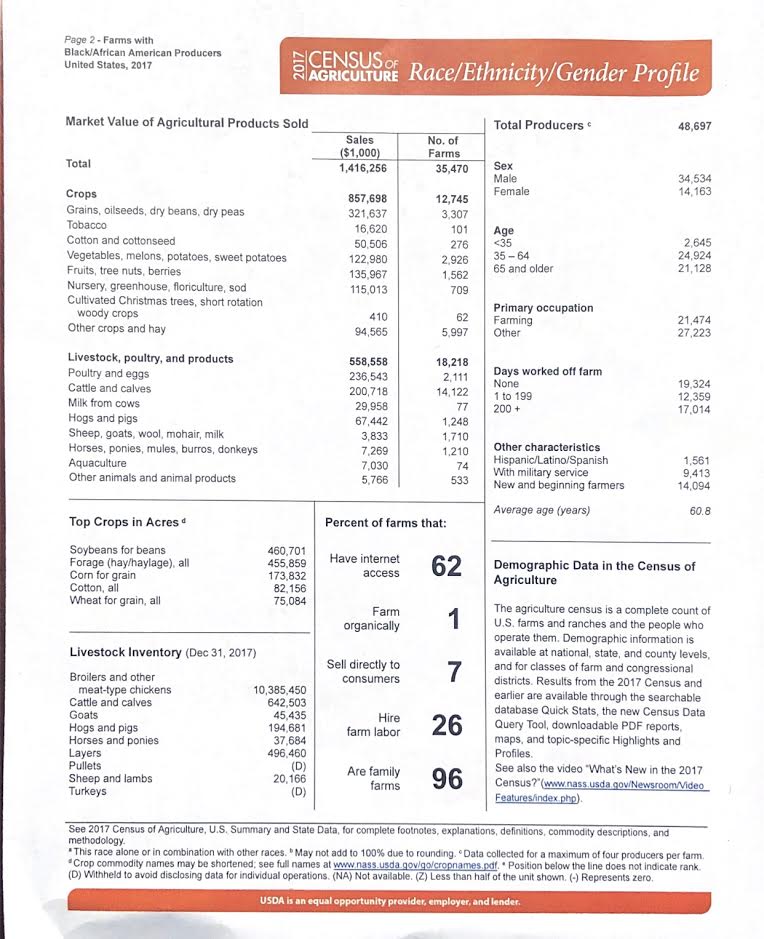
Number of Farms: 35,470 (36,382)

Land in farms (acres): 4,673,140 (4,563,805)

Average size of farm (acres): 132 (125)

Market Value of products sold: $1,416,256,000 ($1,311,6332,000)

Market Value of crops sold: $857,698,000

Market value of livestock, poultry, & products: $558,558,000

Government payments: $58,807,000 (60,731,000)

Average Per Farm Receiving Payments: $7,108 ($5,509)

69 Percent of African American Farms are between 10-180 acres

4 Percent of African American Farms are over 500 acres

43 percent of African American farmers are over the age of 65

5 percent of African American farmers are under the age of 35


HBCU Money™ Histronomics: 1920 Agricultural Census Of Colored Farms & Land Ownership

Screen Shot 2014-07-12 at 12.25.42 PM

HIGHLIGHTS

  • Total American Farm Acres in 1920 – 956 million acres
  • Economic value of Total American Farm Acres – $66 billion
  • Total Colored Acres in 1920 – 45 million acres
  • Economic value of Total Colored Farm Acres – $2.5 billion
  • % of Total Farm Land Owned by Colored in 1920 – 4.7%
  • Average Colored Farm Acreage in 1920 – 47.3 acres
  • Average Economic Value of African American Farms in 1920 – $2 063

*Colored in the census encompasses African, Native, Japanese, and Chinese Americans. African Americans comprised 97.5% of the colored farm operators in 1920.

Screen Shot 2014-07-12 at 11.58.35 AM

2012’s African American Farm Land Ownership By State

california-farmland--black-and-white-peter-tellone

Farms with a Black or African American Principal Producer

  1. TEXAS – 929,003 acres
  2. MISSISSIPPI – 554,463 acres
  3. ALABAMA – 296,432 acres
  4. OKLAHOMA – 251,680 acres
  5. GEORGIA – 221,290 acres
  6. LOUISIANA – 192,287 acres
  7. SOUTH CAROLINA – 191,452 acres
  8. VIRGINIA – 176,571 acres
  9. NORTH CAROLINA – 152,899 acres
  10. ARKANSAS – 149,530 acres
  11. TENNESSEE – 102,196 acres
  12. FLORIDA – 92,324 acres
  13. NEW MEXICO – 61,300 acres
  14. CALIFORNIA – 32,932 acres
  15. KENTUCKY – 31,483 acres
  16. KANSAS – 29,174 acres
  17. MINNESOTA – 26,193 acres
  18. MISSOURI – 20,107 acres
  19. ILLINOIS – 19,843 acres
  20. OHIO – 11,883 acres
  21. MARYLAND – 10,065 acres
  22. MICHIGAN – 9,525 acres
  23. COLORADO – 7,368 acres
  24. IDAHO – 6,613 acres
  25. NEW YORK – 6,059 acres
  26. WASHINGTON – 5,744 acres
  27. MONTANA – 5,714 acres
  28. INDIANA – 5,704 acres
  29. NEBRASKA – 5,249 acres
  30. WEST VIRGINIA – 3,584 acres
  31. IOWA – 3,332 acres
  32. OREGON – 2,481 acres
  33. NORTH DAKOTA – 2,230 acres
  34. ARIZONA – 1,941 acres
  35. NEW JERSEY – 1,038 acres
  36. MASSACHUSETTS – 983 acres
  37. DELAWARE – 792 acres
  38. VERMONT – 740 acres
  39. MAINE – 363 acres
  40. UTAH – 344 acres
  41. CONNECTICUT – 118 acres
  42. NEW HAMPSHIRE  – 84 acres
  43. HAWAII – (D)
  44. NEVADA – (D)
  45. PENNSYLVANIA – (D)
  46. RHODE ISLAND – (D)
  47. SOUTH DAKOTA – (D)
  48. WISCONSIN – (D)
  49. WYOMING – (D)

Total African American Principal Producer Acres: 3,645,289

Total United States Principal Producer Acres: 914,527,657

African American Percentage: 0.40%

Source: USDA