“If you don’t find a way to make money while you sleep, you will work until you die.” — T. Harv Eker
Consider two farmers working adjacent plots of land. The first rises before dawn every morning, tills his soil by hand, plants his seeds, and harvests his crop himself. He is disciplined, tireless, and skilled. The second farmer also works diligently, but years ago he invested in irrigation systems, acquired additional acreage, and hired capable hands to manage the daily operations. Each morning, while both men are productive, the second farmer’s land is already generating yield before he laces his boots. By harvest season, the gap between them is not a matter of effort it is a matter of systems.
Now imagine that the first farmer was legally prohibited, for generations, from owning irrigation equipment. That he was denied title to additional acreage by the institutions that financed everyone else’s expansion. That every time he accumulated enough surplus to invest in infrastructure, external forces — legal, financial, social — interrupted the accumulation. By the time those prohibitions were lifted, the second farmer’s systems had compounded across decades. His children inherited not just land, but infrastructure. The first farmer’s children inherited his work ethic, and little else.
This is not a parable about laziness or ambition. It is a precise structural description of the passive income gap that defines African American economic life in the early twenty-first century and understanding it in those terms is the prerequisite to closing it.
In the American imagination, wealth is synonymous with work. The culture celebrates grit, discipline, and the relentless pursuit of the paycheck. Yet the country’s most economically durable families rarely labor for their living in the conventional sense. Their fortunes compound quietly through investments, dividend-paying equities, rental properties, and business interests that operate independent of their daily involvement. The accumulation of such passive income streams is not merely a personal finance preference it is the mechanism through which wealth reproduces itself across generations. And according to data from the U.S. Census Bureau and the Federal Reserve, African American households are more structurally excluded from that mechanism than any other major demographic group in the country.
Only approximately seven percent of Black households report receiving passive income of any kind whether from rental properties, interest-bearing instruments, dividends, or business ownership. By comparison, roughly twenty-four percent of white households report such income. The disparity in amounts is equally stark: the median passive income for Black families barely reaches two thousand dollars annually, compared to nearly five thousand dollars for white households. These are not marginal differences. They represent a fundamental divergence in how wealth is structured and reproduced and they do not emerge from differences in financial discipline or cultural values. They emerge from history operating through institutions.
The mechanics of that history are well documented, even if their ongoing consequences are frequently underestimated. For much of the twentieth century, the institutional infrastructure of American wealth-building was explicitly closed to Black participation. Federal mortgage programs underwrote suburban homeownership for millions of white families in the postwar decades while systematically excluding Black applicants through redlining and racially restrictive covenants. The GI Bill, nominally universal, was administered through local institutions that largely denied Black veterans access to its most wealth-generating provisions, the low-interest mortgages and business loans that seeded a generation of white middle-class asset ownership. Stock brokers ignored Black neighborhoods. Community banks serving Black depositors were chronically undercapitalized and disproportionately targeted for closure. The Freedman’s Savings Bank, established specifically to channel Black economic activity into formal financial infrastructure, was mismanaged into collapse within a decade of its founding, an early and formative lesson in institutional betrayal that resonates through surveys of Black financial trust to this day.
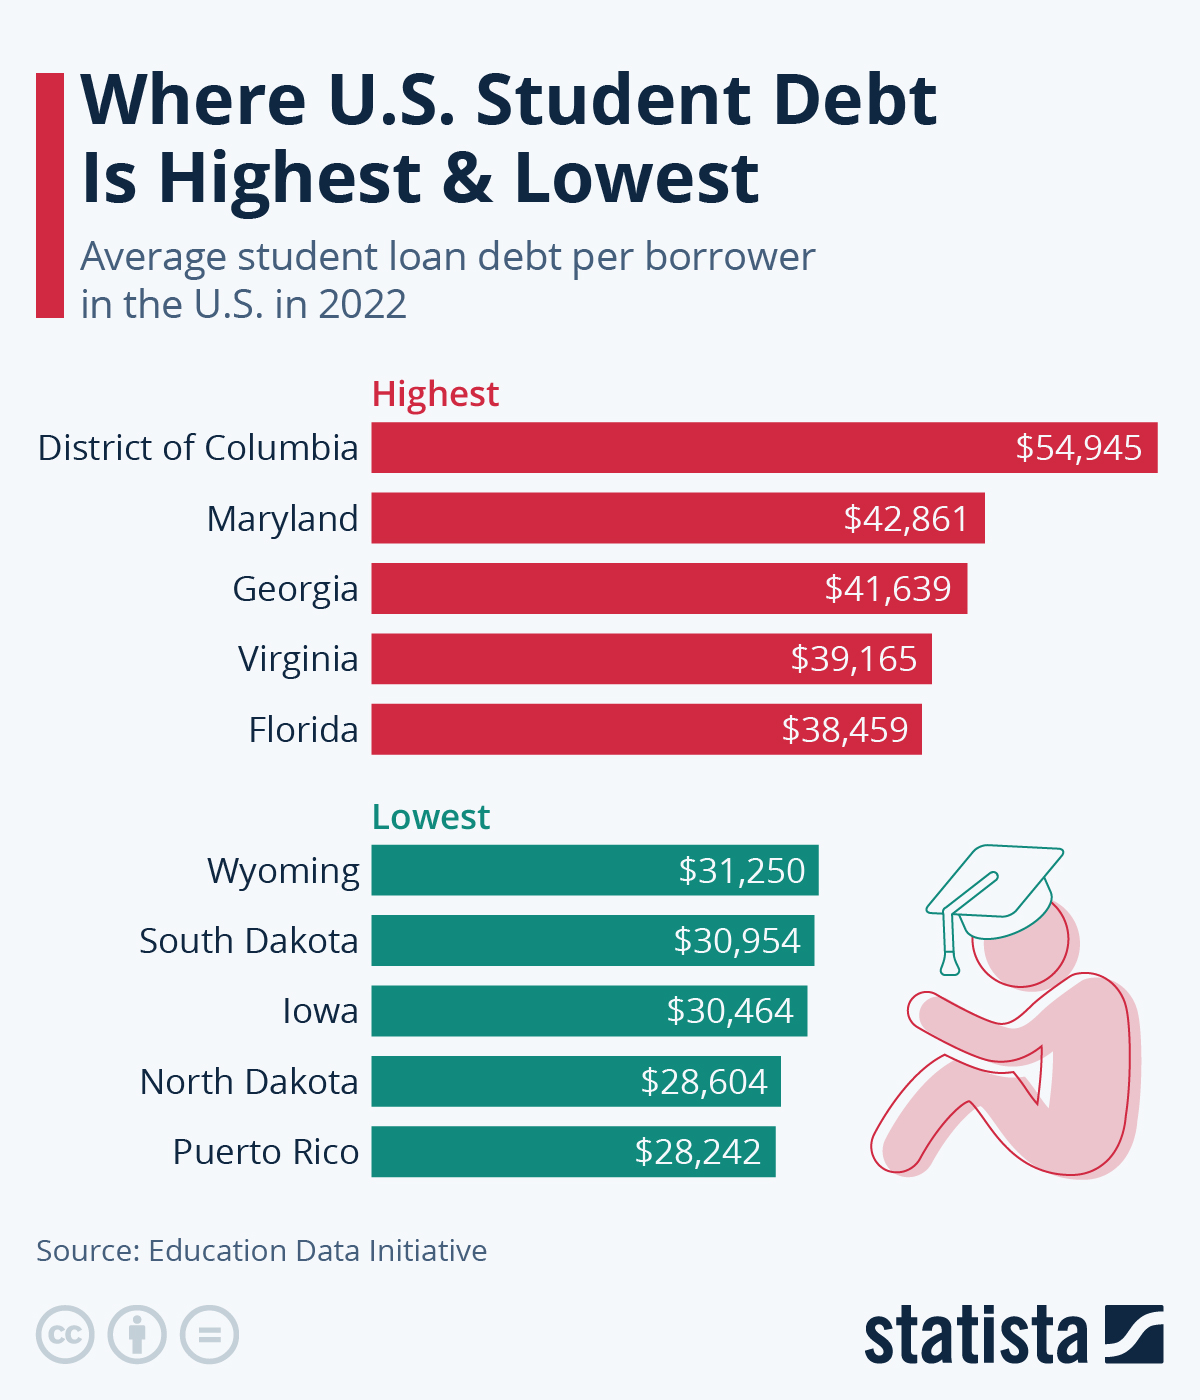
The result of these compounding exclusions is a wealth ecosystem structurally oriented toward earned income rather than asset income. Black households are more likely to rely entirely on wages and salaries, less likely to hold inherited financial assets, and more burdened by student loan debt, a combination that severely constrains the capital available for investment in income-generating assets. Asset inequality is, in this respect, more consequential than income inequality. A household can earn a substantial salary and still possess near-zero wealth if it holds no appreciating assets. Without passive income streams, every financial obligation must be met from current earnings, leaving no margin for accumulation, no buffer against disruption, and nothing to transmit to the next generation. The passive income gap is therefore not merely a measure of present financial well-being it is a structural indicator of generational economic capacity.

The equity markets represent the most accessible entry point into passive income for households without inherited capital. The proliferation of low-cost index funds and exchange-traded funds has dramatically lowered the technical and financial barriers to market participation. A diversified position in a broad market index fund can now be established with modest, regular contributions, and fractional share platforms have effectively eliminated the minimum capital requirements that once made meaningful market participation inaccessible for many lower- and middle-income investors. Among Black households, market participation has increased measurably in recent years, accelerated in part by the financial disruptions and digital financial education that accompanied the pandemic period. Dividend reinvestment plans which automatically direct dividend payments into additional share purchases allow even small positions to compound without requiring additional capital contributions. These are not trivial instruments. Deployed consistently over time, they are the infrastructure through which institutional endowments and old-money family offices have maintained their positions across generations. They are now, for the first time in any meaningful sense, structurally available to households without inherited wealth.
Real estate has historically functioned as the second pillar of American household wealth accumulation, and its role in the passive income gap is correspondingly significant. The Black homeownership rate stood at approximately 44 percent as recently as 2022 — a figure notably lower than it was when the Fair Housing Act was passed in 1968, reflecting not merely the legacy of discriminatory exclusion but also the continuing structural disadvantages that Black households face in mortgage markets, including higher denial rates, less favorable loan terms, and reduced access to the equity-rich suburban markets where appreciation has been most concentrated. Homeownership is not, by itself, a passive income strategy but it is the entry point through which most households access the equity necessary to finance investment property acquisition. The ownership gap is therefore a compounding disadvantage: it reduces both wealth and the capacity to generate wealth-from-wealth.
Emerging platforms have begun to partially address this barrier through fractional real estate investment vehicles that allow individuals to acquire positions in income-generating properties without the capital requirements of direct ownership. Models built around real estate investment trusts provide exposure to rental income streams at low entry thresholds. More structurally interesting are the cooperative investment models emerging in cities including Birmingham, Baltimore, and Chicago, where Black investors are pooling capital to acquire multi-family residential properties and distributing rental income proportionally among participants. These arrangements draw on a long tradition of cooperative capital formation, the rotating savings circles and community lending mechanisms that have historically served as informal substitutes for formal financial infrastructure in excluded communities and are now being formalized and scaled through digital coordination tools and legal structures designed for collective ownership. The model is neither novel nor experimental in the broader historical context; variations on it have been used by Jewish, Chinese, and Caribbean diaspora communities as mechanisms for capital accumulation in the absence of full access to mainstream financial markets. Its resurgence in African American communities reflects both necessity and strategic clarity.
Business ownership represents perhaps the most consequential pathway to passive income, particularly for businesses structured to operate without requiring the founder’s continuous direct involvement. The income generated by a well-organized business is qualitatively different from wages as it is not capped by hours worked and can, in principle, be transmitted to heirs through equity transfer. Yet Black-owned businesses face systematic barriers to the capital necessary to reach the scale at which passive ownership becomes possible. A 2021 analysis by the Brookings Institution found that Black-owned businesses were roughly half as likely to receive funding as their white-owned counterparts, and received approximately one-third as much capital even when controlling for creditworthiness. The consequence is a concentration of Black entrepreneurship at the micro-enterprise level, where businesses are structurally dependent on the founder’s labor and consequently cannot generate the passive returns that characterize institutional-scale business ownership.
Digital business models have partially disrupted this barrier. Information products like online courses, subscription content, software tools, and digital publications require relatively low startup capital and can generate recurring revenue without proportional increases in labor. The emergence of platform infrastructure for content monetization has created genuine passive income streams for creators and educators operating at modest scale. These are not transformative institutional mechanisms on their own, but they represent a meaningful point of entry for households seeking to establish income streams beyond wages, and they are increasingly being pursued with strategic intentionality by individuals embedded in broader networks of Black financial education and community investment.
The cultural dimension of financial trust cannot be analytically separated from the structural picture. Survey data consistently document lower levels of trust in financial institutions among Black Americans — a pattern that persists even after controlling for income and education levels. This distrust is not irrational. It reflects an accurate historical assessment of institutional behavior: from the collapse of the Freedman’s Bank in 1874 to the predatory lending practices that concentrated subprime mortgage products in Black neighborhoods during the 2000s housing cycle, the relationship between Black households and formal financial institutions has been characterized by recurring exploitation and exclusion. The result is that a meaningful portion of the passive income gap reflects not ignorance of investment vehicles but rational caution about the institutions through which those vehicles are accessed. Closing the gap therefore requires not only financial education but institutional reconstruction, the development of Black-owned and Black-serving financial infrastructure that can provide access to capital markets through institutions whose incentive structures are aligned with their depositors’ and investors’ interests.

Community development financial institutions, Black-owned credit unions, and the financial operations of HBCUs themselves represent the institutional layer through which this reconstruction must occur. HBCU endowments, though modest relative to their peer institutions at predominantly white universities, serve as collective investment vehicles for the institutional community — and their growth is directly linked to the capacity of these institutions to generate passive income that funds scholarships, research, and operational independence. An HBCU with a three-hundred-million-dollar endowment generating a five-percent annual return has fifteen million dollars of non-tuition, non-appropriation income available for strategic deployment. An HBCU with a thirty-million-dollar endowment has one-tenth that capacity. The endowment gap is, at the institutional level, an exact structural analog of the household passive income gap and it carries the same generational implications. Institutions that cannot generate income from assets must perpetually depend on current revenue, limiting their strategic horizon to the immediate fiscal year and rendering them structurally unable to absorb disruption or invest in long-term capacity.
The policy dimension of this problem demands a more clear-eyed analysis than it typically receives, particularly given the political environment in which African American institutions now operate. The standard progressive policy toolkit — baby bonds, expanded retirement account access, first-time homebuyer assistance — rests on a premise that is increasingly difficult to sustain: that the federal government is a reliable or even neutral partner in the project of Black wealth-building. The current political configuration has demonstrated, with considerable consistency, that federal programs nominally universal in design are administered in ways that do not correct for existing disparities. Baby bonds are instructive precisely because their limitations reveal the problem. A program that provides every child an equal account at birth does not close a gap, it freezes it. A Black child beginning life in a household with negligible net worth, in a neighborhood with depressed property values, attending an underfunded school, and likely to carry disproportionate student debt into adulthood does not need the same starting account as a white child born into inherited equity and institutional access. Equal treatment applied to unequal conditions produces unequal outcomes. That is not a reform strategy. It is a restatement of the problem in more palatable language.
The more productive analytical frame is institutional self-sufficiency where the deliberate construction of economic infrastructure that does not depend on federal goodwill for its operation. This means directing capital toward Black-owned banks and credit unions capable of underwriting mortgages and business loans within the ecosystem, rather than routing every dollar of financial activity through institutions whose risk models and lending criteria systematically disadvantage Black borrowers. It means building the capitalization of HBCU endowments and community development financial institutions to the level where they can function as genuine sources of patient capital by financing real estate development, seeding early-stage enterprises, and providing the long-term investment infrastructure that currently exists almost exclusively outside the Black institutional ecosystem. And it means pursuing, at the state and municipal level, the targeted policy interventions that remain viable where federal action has become unreliable: land trusts, community investment tax credits, procurement preferences for Black-owned firms, and regulatory frameworks that support cooperative ownership structures. The political geography of the United States still contains jurisdictions where these instruments are achievable. The strategic priority is to concentrate and coordinate their use.
The passive income gap is ultimately a structural problem with structural solutions. For African American households, the accumulation of income-generating assets has been systematically disrupted across generations by explicit policy and institutional exclusion. What has emerged is a wealth ecosystem oriented almost entirely toward labor income — economically fragile, generationally limited, and structurally disconnected from the compounding mechanisms through which durable wealth reproduces itself. Addressing this gap requires coordinated action across multiple institutional levels: household investment behavior, community capital formation, HBCU endowment strategy, Black-owned financial infrastructure, and federal policy. No single mechanism is sufficient. The challenge is to build, simultaneously, the individual financial practices and the institutional architecture through which those practices can achieve scale.
The farmers in the opening parable were not separated by work ethic. They were separated by infrastructure — by access to the systems that allow effort to compound. The task before African American institutions and households is not to work harder. It is to build the irrigation.
Final Takeaways: Actionable Steps
🔹 Step 1: Open a brokerage account (Fidelity, Vanguard, or Charles Schwab) and start investing in stocks, ETFs, or REITs.
🔹 Step 2: If possible, buy a rental property or start with REITs for real estate exposure.
🔹 Step 3: Automate savings & investments through 401(k), Roth IRA, or Robo-advisors.
🔹 Step 4: Explore low-risk passive businesses.
🔹 Step 5: Consider group investing with family or community investment clubs.