Unity National Bank, headquartered in Houston, Texas, with $209 million in assets, is the eighth largest African American owned bank by assets. It is located just a stone’s throw away from Texas Southern University. Recently the bank named Pedro Bryant, a Morris Brown College alum, its new CEO and President. Unity National Bank has an immense opportunity to move up the rankings for African American banks with the right strategy. According to an Apartment List report in February 2024, San Antonio, Houston, Dallas, and Austin rank as the third, fourth, sixth, and seventh best cities in the US for African American professionals. Lendio also reports that Texas is home to over 400,000 African American owned businesses and almost 13,000 are employer firms. These ingredients mean that with Unity National Bank being the only African American owned bank in the state the runway for growth is theirs to capture. This also means a strengthening of ties between HBCUs and the African America private sector are that much stronger. The lack of cohesion between the two institutions (100 HBCUs and 16 African American owned banks) has largely been one of the key ingredients holding back the African American economy as intellectual and economic capital rarely circulates between HBCUs and the African American owned employer firms.
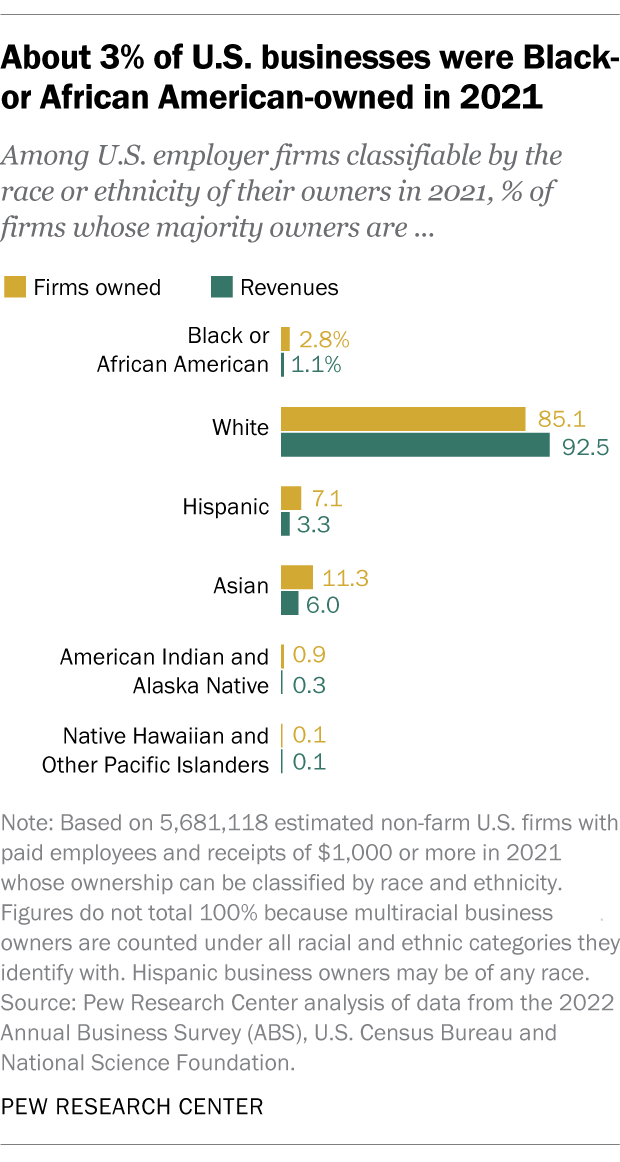
Pew Research Center highlights a look at the 161,031 U.S. firms with majority African American ownership as of 2021. Below are a few of the highlighted graphs that Pew Research showed in their report with HBCU Money commentary.
According to the SBA there were approximately 3.2 million African American-owned businesses as of 2018, but that is just the top layer. When you dig into the numbers by the Census of how many of those 3.2 million African American-owned businesses actually have paid employees and receipts exceeding $1,000 that number plummets to the previously mentioned 161,031 or only 5 percent of total African American-owned businesses.
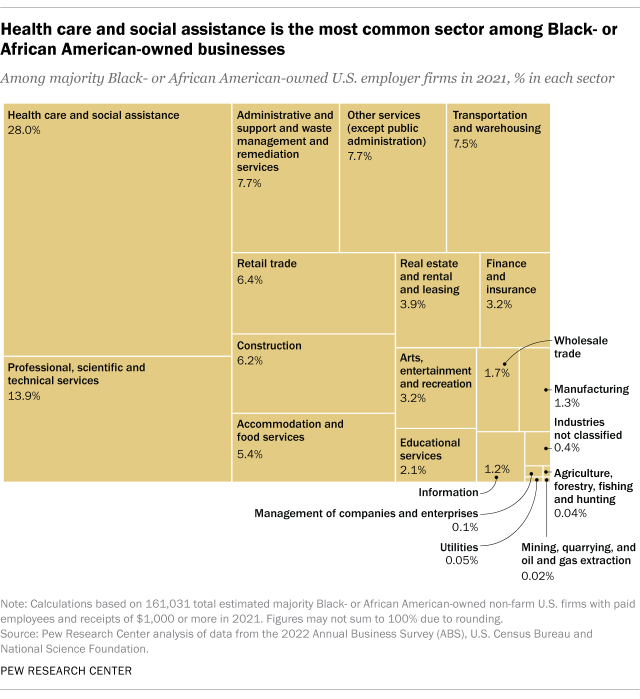
African American businesses are highly concentrated in health care and social assistance. Businesses that often have low scale potential and high risk often times due their clients being predominantly African American and higher probability of being uninsured. Where are the African American-owned energy companies? Manufacturing companies? Multinational firms? These are the questions that need to be asked, considered, and discussed by HBCU business schools and African American organizations like the HBCU Chamber of Commerce.
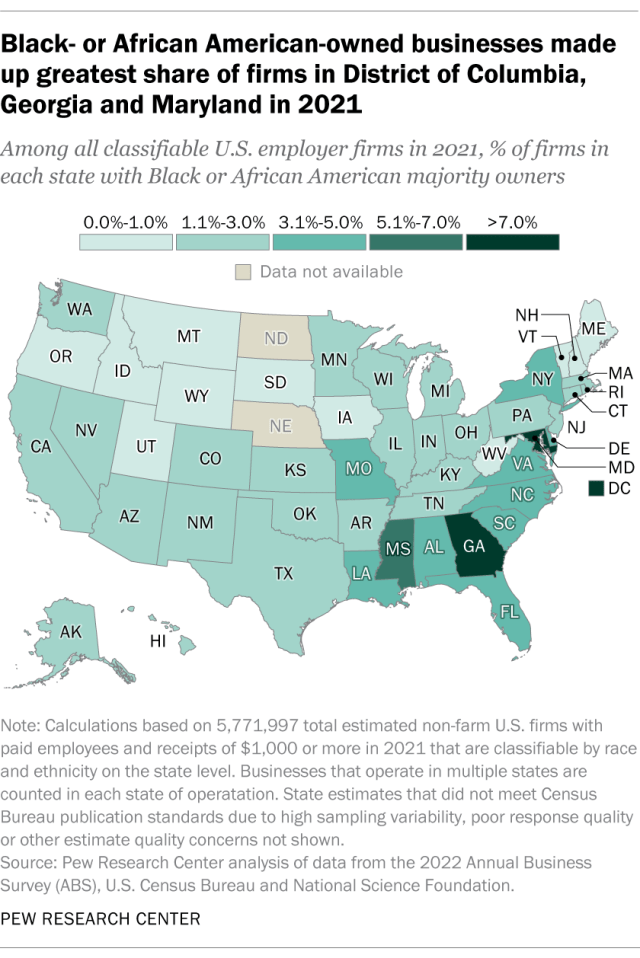
It is no surprise that the highest concentration of African American-owned businesses are in locations with higher African American density populations and high concentrations of HBCUs. HBCUs and HBCU alumni unfortunately are not doing enough to create investment infrastructure to ensure the businesses are able to go into less explored and more profitable areas as the aforementioned graph highlighted.
For the full Pew Research Center report click here.
“History shows that it does not matter who is in power or what revolutionary forces take over the government, those who have not learned to do for themselves and have to depend solely on others never obtain any more rights or privileges in the end than they had in the beginning.” – Carter G. Woodson, The Mis-education of the Negro
Last year, I said this was a marathon and not a sprint. However, at this moment a year later it does feel like we are picking up speed. Over the years there have been setbacks and bumps and ascending moments. Moments where I believed we were set to takeoff and moments where it felt like this was going to crash. It is truly amazing that 12 years in throughout everything, HBCU Money is still here and it is still strong.
There is nothing that I desire more than to see it expand, to see it be part of the fabric of representing the information of the HBCU nation and community. That we maybe empowered to shape our own narrative and that African America one days truly sees the value in our own institutions as others do. My goal is and continues to be that HBCU Money be part of the fabric of an ecosystem of HBCU Alumni Owned media that shows just how powerful we can truly be when we take ownership into our own hands.
As HBCU Money continues its path along with our sister blog HBCU Politics and more waiting in the weekends it will soon see the long transformation from caterpillar to butterfly – with a sting like a bee.
Keep your eyes on the horizon and know that the sunrise of our day is still upon us.
“With segregation, with the isolation of the injured and the robbed, comes the concentration of disadvantage. An unsegregated America might see poverty, and all its effects, spread across the country with no particular bias toward skin color. Instead, the concentration of poverty has been paired with a concentration of melanin.” – Ta-Nehisi Coates
HBCUs and PBIs are arguably African American institutions that are built to solve and protect African American interests. There is no greater crisis that currently faces African American economically than its poverty. Its impact across all statistics like health outcomes, civic participation, business creation, student loan debt, and the list goes on and on. What exactly HBCUs and PBIs are doing about African American poverty in their cities and states is complicated to address. Many would say that simply graduating the number of African Americans with degrees is more than enough. That is until you realize the depth and impact our counterparts are using their higher educational institutions to do. MIT has an incubator that allows students to create companies while matriculating. Schools like Stanford have helped create Google, Harvard is the birthplace of Facebook, University of Texas and Texas A&M formed UTIMCO to create the nation’s largest endowment, and much more. PWIs banking with banks like J.P. Morgan, Wells Fargo, and others ensuring that European American owned banks have a deposit base that allows them to conduct the business of financially protecting their community and lending for European American homeownership and small business creation. HBCUs, not so much. It is also not just the HBCUs, but HBCU foundations, HBCU alumni associations, and other organizations that are supposed to be part of the vanguard/ecosystem of African American institutional development that pulls African American individuals, families, and communities away from poverty in conjunction with other African American institutions.
Poverty is already a complex and layered system and African American poverty is that on steroids. Each state and the HBCU/PBIs institutional system in it are part of the counterattack against African American poverty. Or at least we want them to be. For the alumni and administrations who see their institutional system as part of the empowerment and pulling of African America out of the throws of poverty it requires to know the actual depths of the situation.
Among the U.S. states with the highest poverty rates for 2022, HBCU/PBI states constituted 8 out of the top 10 for overall poverty.
ALABAMA
Overall Poverty (2020): 15.5%
Overall Poverty (2015): 19.3%
African American Poverty (2020): 23.5%
African American Poverty (2015): 31.1%
Change In African American Poverty 2015-2020: Decreased 24.4%
ARKANSAS
Overall Poverty (2020): 16.2%
Overall Poverty (2015): 18.9%
African American Poverty (2020): 27.1%*
African American Poverty (2015): 33.2%*
Change In African American Poverty 2015-2020: Decreased 18.4%
CALIFORNIA
Overall Poverty (2020): 11.8%
Overall Poverty (2015): 16.5%
African American Poverty (2020): 19.0%*
African American Poverty (2015): 25.4%*
Change In African American Poverty 2015-2020: Decreased 25.2%
DELAWARE
Overall Poverty (2020): 11.3%
Overall Poverty (2015): 12.5%
African American Poverty (2020): 17.3%
African American Poverty (2015): 19.9%
Change In African American Poverty 2015-2020: Decreased 13.1%
DISTRICT OF COLUMBIA
Overall Poverty (2020): 13.5%
Overall Poverty (2015): 17.7%
African American Poverty (2020): 21.6%*
African American Poverty (2015): 25.9%*
Change In African American Poverty 2015-2020: Decreased 16.6%
FLORIDA
Overall Poverty (2020): 12.7%
Overall Poverty (2015): 16.5%
African American Poverty (2020): 19.8%*
African American Poverty (2015): 26.9%*
Change In African American Poverty 2015-2020: Decreased 26.4%
GEORGIA
Overall Poverty (2020): 13.3%
Overall Poverty (2015): 18.3%
African American Poverty (2020): 18.8%
African American Poverty (2015): 27.0%
Change In African American Poverty 2015-2020: Decreased 30.1%
ILLINOIS
Overall Poverty (2020): 11.5%
Overall Poverty (2015): 14.4%
African American Poverty (2020): 24.2%*
African American Poverty (2015): 30.6%*
Change In African American Poverty 2015-2020: Decreased 20.9%
KENTUCKY
Overall Poverty (2020): 16.3%
Overall Poverty (2015): 19.1%
African American Poverty (2020): 24.4%*
African American Poverty (2015): 32.4%
Change In African American Poverty 2015-2020: Decreased 24.7%
LOUISIANA
Overall Poverty (2020): 19.0%
Overall Poverty (2015): 19.8%
African American Poverty (2020): 29.4%*
African American Poverty (2015): 33.7%*
Change In African American Poverty 2015-2020: Decreased 12.8%
MARYLAND
Overall Poverty (2020): 9.0%
Overall Poverty (2015): 10.1%
African American Poverty (2020): 12.9%
African American Poverty (2015): 14.6%*
Change In African American Poverty 2015-2020: Decreased 11.6%
MASSACHUSETTS
Overall Poverty (2020): 9.4%
Overall Poverty (2015): 11.6%
African American Poverty (2020): 17.6%
African American Poverty (2015): 21.8%
Change In African American Poverty 2015-2020: Decreased 19.3%
MICHIGAN
Overall Poverty (2020): 13.0%
Overall Poverty (2015): 16.2%
African American Poverty (2020): 25.9%*
African American Poverty (2015): 33.0%*
Change In African American Poverty 2015-2020: Decreased 21.5%
MISSISSIPPI
Overall Poverty (2020): 19.6%
Overall Poverty (2015): 21.5%
African American Poverty (2020): 30.7%
African American Poverty (2015): 34.3%*
Change In African American Poverty 2015-2020: Decreased 10.5%
MISSOURI
Overall Poverty (2020): 12.9%
Overall Poverty (2015): 15.5%
African American Poverty (2020): 21.2%
African American Poverty (2015): 28.1%*
Change In African American Poverty 2015-2020: Decreased 24.6%
NEW YORK
Overall Poverty (2020): 13.0%
Overall Poverty (2015): 15.9%
African American Poverty (2020): 20.0%
African American Poverty (2015): 23.2%
Change In African American Poverty 2015-2020: Decreased 13.8%
NORTH CAROLINA
Overall Poverty (2020): 13.6%
Overall Poverty (2015): 17.2%
African American Poverty (2020): 21.5%
African American Poverty (2015): 26.5%
Change In African American Poverty 2015-2020: Decreased 18.9%
OHIO
Overall Poverty (2020): 13.1%
Overall Poverty (2015): 15.8%
African American Poverty (2020): 27.3%*
African American Poverty (2015): 34.7%*
Change In African American Poverty 2015-2020: Decreased 21.3%
OKLAHOMA
Overall Poverty (2020): 15.2%
Overall Poverty (2015): 16.6%
African American Poverty (2020): 28.2%*
African American Poverty (2015): 29.9%*
Change In African American Poverty 2015-2020: Decreased 5.7%
PENNSYLVANIA
Overall Poverty (2020): 12.0%
Overall Poverty (2015): 13.6%
African American Poverty (2020): 24.9%
African American Poverty (2015): 29.5%
Change In African American Poverty 2015-2020: Decreased 15.6%
SOUTH CAROLINA
Overall Poverty (2020): 13.8%
Overall Poverty (2015): 16.8%
African American Poverty (2020): 23.1%*
African American Poverty (2015): 26.0%
Change In African American Poverty 2015-2020: Decreased 11.2%
TENNESSEE
Overall Poverty (2020): 13.9%
Overall Poverty (2015): 18.3%
African American Poverty (2020): 21.5%
African American Poverty (2015): 30.9%
Change In African American Poverty 2015-2020: Decreased 30.4%
TEXAS
Overall Poverty (2020): 13.6%
Overall Poverty (2015): 17.2%
African American Poverty (2020): 18.6%
African American Poverty (2015): 23.2%
Change In African American Poverty 2015-2020: Decreased 19.8%
VIRGINIA
Overall Poverty (2020): 9.9%
Overall Poverty (2015): 11.8%
African American Poverty (2020): 16.4%*
African American Poverty (2015): 21.2%*
Change In African American Poverty 2015-2020: Decreased 22.6%
*Denotes that African Americans had the highest poverty rate among all groups during that period.
Among households with income between $30,000 and $50,000, 8.0 percent of African American households were unbanked compared with 1.7 percent of European American households.
Despite being the lowest unbanked group at 1.7 percent, African Americans earning $75,000 or more are still almost 600 percent more unbanked than their European American counterparts at the same income level. The largest gap among all income levels reported.
Among households with income between $50,000 and $75,000, 64.8 percent of African American households had a credit card or bank personal loan, whereas 81.3 percent of European American households did so.
Unbanked among African Americans has dropped from 16.8 percent in 2017 down to 11.3 percent in 2021. A reduction of almost 33 percent. European Americans have the lowest unbanked rate at 2.1 percent followed by Asian Americans at 2.9 percent.
21.4 percent of African American single-mother households were unbanked in 2021, compared with 8.0 percent of European American single-mother households.
Interest in having a bank account was also higher among African American unbanked households (32.0 percent were very or somewhat interested in having an account in 2021).
African American households comprised 12.8 percent of the overall household population, they made up 41.1 percent of the recently unbanked.
Use of Prepaid Cards by Bank Account Ownership and Selected Household Characteristics was highest among African Americans at 12.3 percent and lowest among Asian Americans at 4.6 percent.
Three in four African American banked households (76.5 percent) used bank accounts to save or keep money safe, a lower share than among households of other races and ethnicities. For example, 85.2 percent of European American banked households saved or kept money safe using bank accounts in 2021.
African American banked households saved or kept money safe using prepaid cards compared with 1.2 percent of European American banked households.
In 2021, 49.9 percent of African American households had a credit card or bank personal loan, compared with 78.8 percent of European American households.
36 percent of African American households are underbanked/unbanked.
Rent-to-Own Service or Payday, Pawn Shop, Tax Refund Anticipation, or Auto Title Loan is used by 7.6 percent of African American households.
To read the full FDIC National Survey of Unbanked and Underbanked Households, click here.