
If you torture the data long enough, it will confess to anything. — Ronald Coase
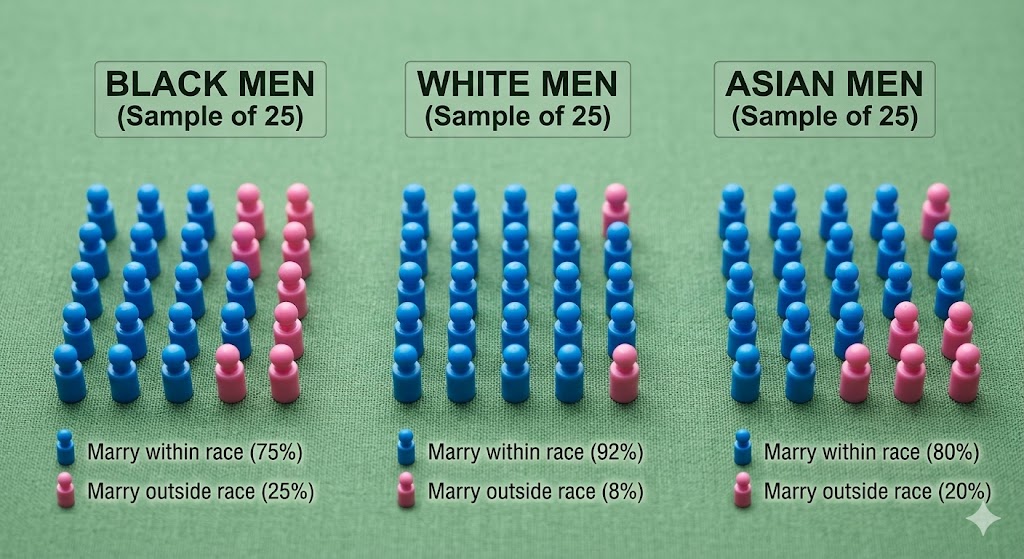
A particular kind of rhetorical move has become standard in Black online discourse around marriage, and it goes roughly like this: Black women claim that Black men are abandoning them for women of other races. Black men respond that the data proves this is false, that the overwhelming majority of Black men who marry do in fact marry Black women. They cite the statistics. They declare the narrative debunked. They move on, satisfied that they have won the argument with evidence.
They have not won the argument. They have answered a question that was not quite being asked, using data that does not quite say what they think it says while simultaneously being correct. This is the uncomfortable, clarifying reality that neither side of this debate has been willing to sit with: both claims are true, they are not in contradiction, and the failure to understand why is fundamentally a failure of data literacy.
The statistics are not in dispute. According to Pew Research Center analysis of U.S. Census data, roughly 75 percent of married Black men are married to Black women. Among newly married Black men, a more precise cohort that captures current behavior rather than accumulated stock, approximately 64 percent marry Black women. These are majority figures. They are decisive. Any claim that Black men have broadly turned away from Black women as partners cannot survive contact with those numbers, and Black men who cite them in their defense are citing real data correctly.
But here is what that same data also shows, in the same reports, on the same pages: among all groups of men in America, Black men have experienced the fastest-growing intermarriage rate over the past four decades, a rise that is without parallel in the data. In 1980, 8 percent of newly married Black men wed outside the race. By 2015, that figure had reached 24 percent, a tripling of the rate over 35 years, while the Black share of the marriage market remained essentially constant. No other male group comes close to that rate of change.
Intermarriage Rates Among Newly Married Adults, by Race and Gender (Pew Research Center, 2015)
| Group | Men | Women | Gender Gap |
| Black | 24% | 12% | 12 pts (M higher) |
| Hispanic | 26% | 28% | 2 pts (F higher) |
| Asian | 21% | 36% | 15 pts (F higher) |
| White | 12% | 10% | 2 pts (M higher) |
Source: Pew Research Center, “Intermarriage in the U.S. 50 Years After Loving v. Virginia” (2017). Newly married = wed within the prior 12 months.
The comparison table requires some careful reading. Hispanic men, at 26 percent, have a nominally higher intermarriage rate than Black men in absolute terms. But Hispanic intermarriage rates have been essentially flat since 1980, shaped by the consistent arrival of immigrant cohorts who marry within their community before subsequent generations integrate more broadly. The Hispanic figure is demographically stable. The Black male figure is demographically dynamic — it moved, substantially and consistently, across a generation.
Intermarriage Rate Trajectory Among Newly Married Men, 1980 vs. 2015 (Pew Research Center)
| Group (Men) | 1980 Rate | 2015 Rate |
| Black men | 8% | 24% (+16 pts) |
| Hispanic men | ~26% | 26% (flat) |
| Asian men | 26% | 21% (slight decline) |
| White men | 4% | 12% (+8 pts) |
Source: Pew Research Center. Hispanic 1980 figure reflects early ACS-era estimates; trajectory reflects relative stability across the period.
The trajectory table is where the Black male pattern becomes impossible to explain away. A rate that triples over 35 years, in a population whose share of the marriage market did not meaningfully change, is not demographic noise. It is a structural signal. Something changed in the conditions under which Black men form partnerships and the data points consistently toward the same structural variable: education and income mobility. Black men who attain a bachelor’s degree intermarry at 30 percent. Black men without a college degree intermarry at 17 percent. The intermarriage rate is not evenly distributed across the Black male population. It concentrates among those with the credentials and income that predict integration into majority-white professional and social environments.
These two facts are majority intra-racial marriage, fastest-growing intermarriage rate among men describe the same population, measured at different scales. The first is an absolute majority statement. The second is a relative and directional statement about change over time. Neither cancels the other. A community can be predominantly endogamous and simultaneously the demographic group whose male intermarriage rate has grown faster than any other in the country. Both coordinates are necessary to accurately describe the terrain. Choosing to cite only one of them is not data literacy. It is data selection which is a different thing entirely, and always in service of a conclusion reached before the data was consulted.
The impulse behind the selective reading is understandable, even if the execution is flawed. Black men have spent years being characterized in cultural commentary as disloyal, as chasing proximity to whiteness, as leveraging any financial or social ascent to exit the community that produced them. That characterization is often unfair, often reductive, and frequently deployed without statistical grounding of its own. The defensive response, reaching for data that proves the accusation false, is a natural one. But a defensive reading of data is still a compromised reading. When you approach a dataset looking for vindication rather than understanding, you will find the numbers that vindicate you and stop there. The 75 percent figure becomes a shield. The trajectory becomes inconvenient and gets left on the table.
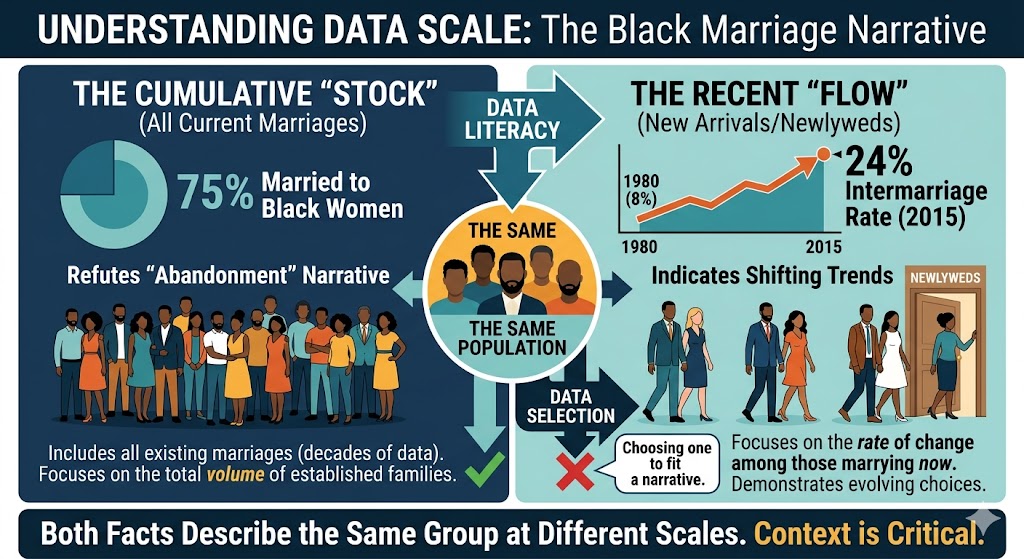
This is precisely what data illiteracy looks like in practice. It is not ignorance of numbers. It is the selective deployment of real numbers to foreclose rather than advance understanding. The person citing the 75 percent is not making a statistical error. They are making an interpretive error by treating a partial truth as a complete one, and treating the absence of explicit contradiction as confirmation. The result is a community that believes it has examined the evidence and settled the question, when in reality it has examined the portion of the evidence that was comfortable and set down the rest.
The gender gap column in the first table is where the conversation should actually be happening. Among every other racial group, the gender intermarriage gap is narrow or runs in the direction of women with Hispanic women and men are essentially equal; Asian women dramatically exceed Asian men; white men and women are within two percentage points of each other. Among Black Americans, the gap is 12 percentage points, and it runs entirely in the direction of men. That gap has been present since at least 1980, and it widens sharply with education: among newly married Black college graduates, 30 percent of men intermarry compared to 13 percent of women. The more education, the wider the gap.
This asymmetry matters because it is not offset. When a Black man marries outside the race, there is no symmetric compensating behavior among Black women. The pool of available same-race partners for Black women, particularly credentialed, economically stable Black women contracts in direct proportion to the Black male intermarriage rate, without equivalent contraction on the other side. Combined with the well-documented effects of incarceration rates on the available Black male population and an educational attainment gap that has shifted decisively toward Black women over three decades, the structural picture that emerges is one of a marriage market with a meaningful and measurable supply-demand imbalance. That imbalance has quantifiable downstream consequences for household wealth formation, given that married households across all racial groups accumulate significantly more wealth than single ones.
None of this is an accusation. It is an accounting. And the distinction matters enormously for how Black communities engage with the question. An accusation calls for defense. An accounting calls for analysis. The man who hears the trajectory data as an indictment of his personal character is reading sociology as if it were a court proceeding. The figures say nothing about any individual’s choices or motivations. They describe population-level patterns with structural determinants, determinants that are, importantly, amenable to institutional response if the community is willing to read the data honestly enough to identify what the actual levers are.
Learning to read data better means, first, understanding the difference between absolute levels and rates of change, and refusing to treat a snapshot as a substitute for a trend. It means placing a number in comparative context not just asking what percentage, but compared to whom, over what period, and moving in which direction. It means sitting with findings that complicate the narrative you prefer, rather than mining the dataset for the figure that ends the conversation on your terms. And it means understanding that two statistics can both be true, can appear to pull in different directions, and can together describe something more accurate and more useful than either describes alone.
Black men are not abandoning Black women en masse. That is true, and the data supports it. Black men have also recorded the fastest-growing intermarriage rate of any male demographic group in America, a rate that has tripled since 1980 and that concentrates among the most educated and economically mobile. That is also true, and the same data supports it. The community that can hold both facts simultaneously without defensiveness and without accusation and ask what structural conditions produce that pattern and what the downstream consequences are for Black household formation and wealth accumulation, is engaging in the kind of rigorous self-examination that serious institutional development requires. The community that cites one number and declares the conversation over is having a different discussion entirely. It is the one that feels better, about a problem it has decided not to fully understand.
Disclaimer: This article was assisted by ClaudeAI.
 HBCU Money