Category Archives: Economics

Mortgage Delinquency Rate Per HBCU State

From 2007 to 2009 there were 2 011 completed foreclosures per 10 000 loans. Of those 2 011 completed foreclosure, 40 percent were African Americans according to the Center for Responsible Lending. African America was second only to Latino America in terms of imminent risk of foreclosure with 21.4 percent and 21.6 percent, respectively, facing imminent foreclosure. Meanwhile, European and Asian America had 14.8 and 15.7 percent, respectively, facing imminent risk of foreclosure. Imminent risk is defined as borrowers who are two or more payments behind on their mortgage.

The Center for Responsible Lending also reports that the cost to the African American community between 2009-2012 due to foreclosures could be an estimated $194 billion. This is equivalent to an estimated 17.6 percent in value of African America’s current buying power for perspective. Below are the overall mortgage delinquency rates for each state that an HBCU is located in and not the mortgage delinquency rates for African Americans in that state.

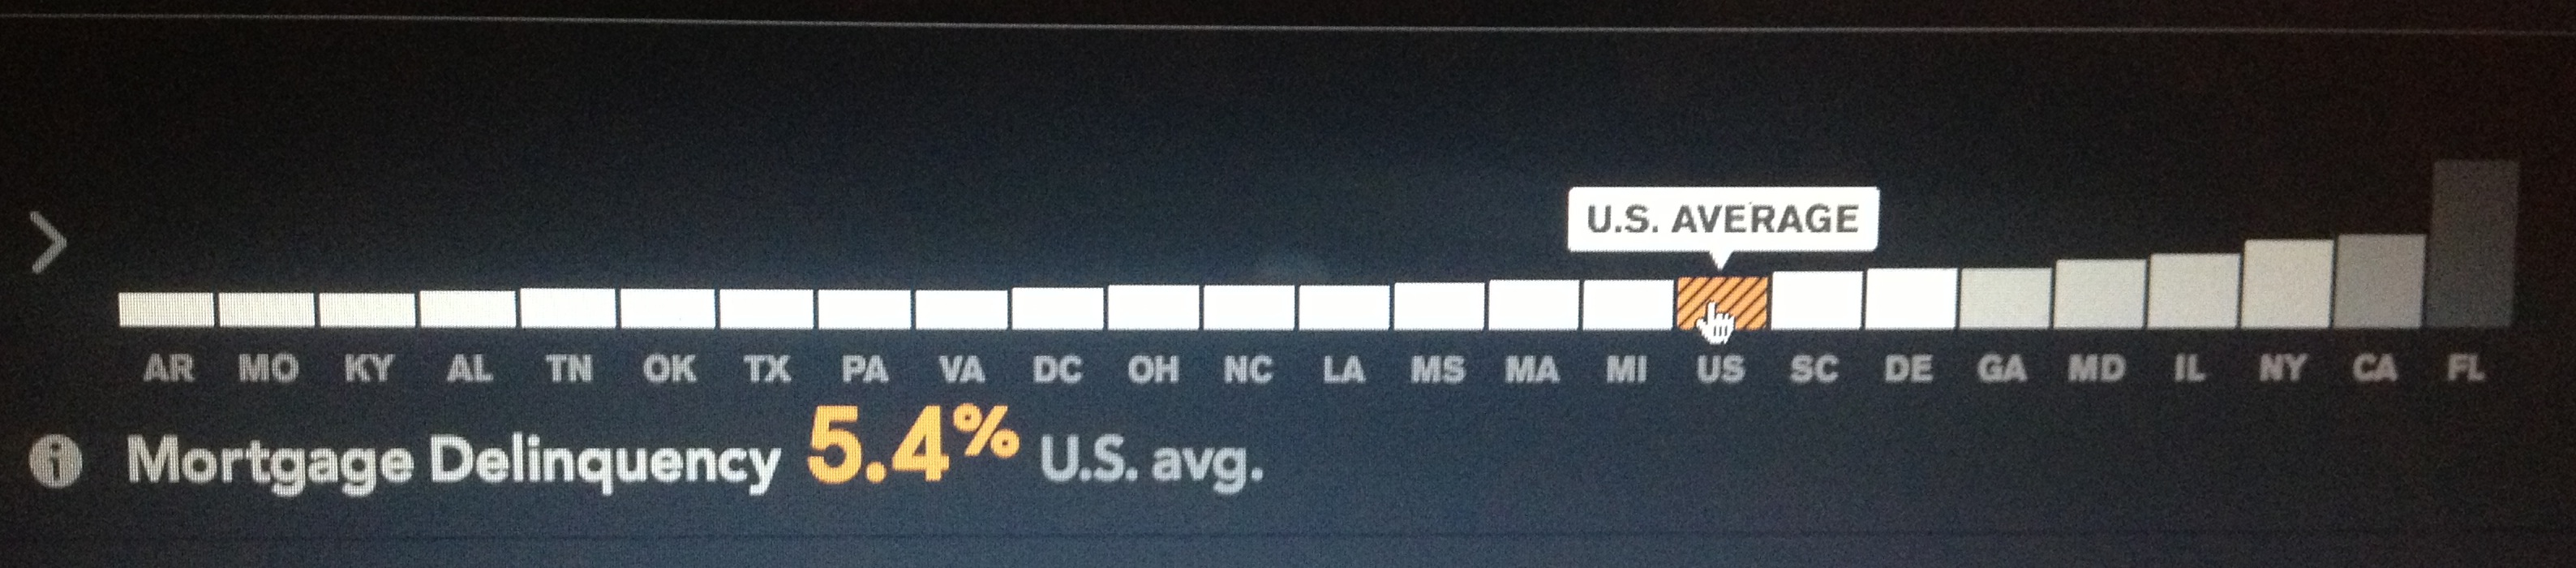
The overall mortgage delinquency rate has risen 54.3 percent from 2008 to 2012 (pictured below). 2008 showed only 10 of the 24 HBCU states and territory being below the national mortgage delinquency rate. 2012 shows 16 of the 24 HBCU states and territory below the national mortgage delinquency rate. South Carolina and Delaware saw rises of 85 percent and 83 percent in their mortgage delinquency rate, respectively, to lead the way in increases. No states saw declines.

morthbcu2008

December 2008

morthbcu

December 2012

STATE – MORTGAGE DELINQUENCY RATE December 2012 (2008)

Arkansas – 3.4% (2.5%)

Missouri – 3.4% (2.5%)

Kentucky – 3.4% (2.6%)

Alabama – 3.7% (2.7%)

Tennessee – 3.9% (2.6%)

Oklahoma – 3.9% (2.7%)

Texas – 4.0% (3.0%)

Pennsylvania – 4.0% (2.5%)

Virginia – 4.0% (3.5%)

Washington D.C. – 4.1% (2.6%)

Ohio – 4.5% (3.5%)

North Carolina – 4.6% (2.6%)

Louisiana – 4.7% (3.0%)

Mississippi – 4.8% (3.3%)

Massachusetts – 5.1% (3.8%)

Michigan – 5.3% (4.0%)

South Carolina – 6.1% (3.3%)

Delaware – 6.4% (3.5%)

Georgia – 6.6% (4.2%)

Maryland – 7.3% (4.9%)

Illinois – 7.9% (4.5%)

New York – 9.5% (5.3%)

California – 10.2% (7.7%)

Florida – 18.9% (12.4%)

Source: Bloomberg Visual Data; Center for Responsible Lending; HBCU Endowment Foundation

African America’s December Unemployment Report – 14.0%

Overall Unemployment: 7.8% (7.7%)

African America Unemployment: 14.0% (13.2%)

Latino America Unemployment: 9.6% (9.9%)

European America Unemployment: 6.9% (6.8%)

Asian America Unemployment: 6.6% (6.4%)

Analysis: Unemployment rates rose across the board for all groups. Asian America maintains the lowest rate. African America showed the largest increase of all groups.

African American Male Unemployment: 14.0% (12.9%)

African American Female Unemployment: 12.2% (11.5%)

African American Teenage Unemployment: 40.5% (39.3%)

African American Male Participation: 67.4% (66.9%)

African American Female Participation: 62.2% (62.3%)

African American Teenage Participation: 25.1% (27.0%)

*Previous month in parentheses.

Analysis: African America saw substantial rises in all groups for unemployment rate. Overall African America added 29 000 jobs. African American male’s saw the largest rise in unemployment rate among all three groups. African America male’s were also the only group to see a rise in their participation rate which is a positive sign as they added 73 000 jobs. African American females participation rate remained stagnant but were able to add 10 000 jobs. Unfortunately, African American teenagers saw their unemployment rate rise and their participation rate fall as they shed 53 000 jobs. African American teenagers continue to be a crisis area for African America largely unnoticed.

Conclusion: African America made up 18.7 percent of the new jobs in December. A percentage well above the population’s percentage but still too few jobs to gain any economic ground amongst the other groups. While the African American male gain is promising, teenage employment loss is extremely troubling given the dependency on African American teenage income for families. African American teenagers continue to have the third highest unemployment rate in the developed world. The gains among African American males is a positive but should be taken with some reservation since most are occurring in low wage jobs. Underemployment continues to plague African America into the new year. As seasonal jobs are shed over the next month we could see the unemployment situation worsen for African America.

Source: Department of Labor

African America’s November Unemployment Report – 13.2%

Overall Unemployment: 7.7% (7.9%)

African America Unemployment: 13.2% (14.3%)

Latino America Unemployment: 10.0% (10.0%)

European America Unemployment: 6.8% (7.0%)

Asian America Unemployment: 6.4% (4.9%)

Analysis: Overall unemployment sees a drop with African America having the most significant drop. Latino America remains unchanged and European America sees a slight drop. Asian America is the only group that has a rise in its unemployment rate but remains the lowest of all groups.

African American Male Unemployment: 13.0% (14.1%)

African American Female Unemployment: 11.4% (12.4%)

African American Teenage Unemployment: 39.4% (40.5%)

African American Male Participation: 67.1% (67.7%)

African American Female Participation: 62.4% (63.9%)

African American Teenage Participation: 27.3% (29.0%)

*Previous month in parentheses.

Analysis: All African American groups see significant drops in unemployment rate and participation rate. The civilian labor force for African America dropped by 300 000 as many stopped looking for work. African American women were the most significant representation of those who stopped looking for work comprising approximately 200 000 or 66 percent of those who left the labor force. Approximately 16 million African Americans were employed last month and the change though downward is negligible. African American men picked up some jobs (44 000) but women and teenagers both saw declines of 80 000 and 19 000 respectively.

Conclusion: The overall economy added 146 000 jobs while African America loss 55 000 jobs. The African American economy continues to drudge along and is exhibiting signs it could be slipping deeper into recession. Hurricane Sandy was said not to have had a major impact on the overall economy but New York City is African America’s largest population center in terms of sheer numbers constituting 5 percent of African America’s total population so it is hard to imagine it not having an impact. The significant drop in African American women out of the labor force is alarming. Given the number of women-headed households being a significant presence in African America, a sign that African American women are discouraged from the job market does not bold well for African American families or the overall health of the African American economy. The loss in jobs is especially troubling because November is usually a time of seasonal hiring for the holidays. Jobs which usually are retail oriented and low wage but vital for families needing the additional income. An inability to increase jobs at this time of year shows an Africa America with a dire situation heading into 2013 as it will have to try to make up for those lost wages. The possibility of shadow market labor that goes unreported in employment numbers could hedge the problem but unlikely to completely stem the tide. Right now if there is good news in the African American economy it is hard to find and with looming political uncertainty around entitlement programs it appears African America could be facing a looming squeeze coupled with declining jobs will extremely hard to prepare for.

Source: Department of Labor

African America’s October Unemployment Report – 14.3%

Overall Unemployment: 7.9% (7.8%)

African America Unemployment: 14.3% (13.4%)

Latino America Unemployment: 10.0% (9.9%)

European America Unemployment: 7.0% (7.0%)

Asian America Unemployment: 4.9% (4.8%)

Analysis: African America saw a significant uptick in the unemployment rate from 13.4% in the previous month. European America’s unemployment rate was unchanged and Asian and Latino America sees negligible uptick.

African American Male Unemployment: 14.1% (14.2%)

African American Female Unemployment: 12.4% (10.9%)

African American Teenage Unemployment: 40.5% (36.7%)

African American Male Participation: 67.7% (67.0%)

African American Female Participation: 63.9% (62.0%)

African American Teenage Participation: 29.0% (28.9%)

*Previous month in parentheses.

Analysis: African American men see a negligible drop in their unemployment while the women and teenager group see significant upticks in their unemployment rate from the previous month. Men and women subgroups both see an increase in their respective participation groups which is a sign that more African Americans are seeking work. African American men added approximately 100,000 to their labor force and also picked up approximately 100,000 employed which largely explains why the participation rate went up and unemployment rate went down. A rare occurrence. African American women added approximately 300,000 to their labor force but only employed 100,000 which explains both significant increases in both participation and unemployment rate. More women are coming back into the job search but the pace at which they are coming is not being matched by employment. African American teenagers labor force shrank as well as number of employed shrank and their unemployment rate is the third highest in the developed world for youth trailing only Spain and Greece.

Conclusion: African American employment is seeing its highest participation rate of the past 5 months but appears to be stuck in a band and really unable to make any significant traction. We could say the glass is half full and that sideways employment is better than declining employment.  Year over year participation is up for the women but men have seen a significant decrease in their participation rate over that same period. Surprisingly, it is the teenage subgroup participation rate that is carrying African America’s overall participation rate year over year from last October as the teenage subgroup has risen from 24.3% in 2011 to its current 28.9% in 2012. Sentiment is up among African America as the number in the labor force is also at its highest in 5 months but caution should prevail as this is the time of year for seasonal hires as the holiday shopping season kicks off which provide for only temporary economic engagement.

Source: Department of Labor

African America’s September Unemployment Report – 13.4%

Overall Unemployment: 7.8%

African America Unemployment: 13.4%

European America Unemployment: 7.0%

Asian America Unemployment: 4.8%

Analysis: Asian America had the largest decline in its unemployment rate dropping from 5.9% to 4.8% overall. African America had the next largest decline from 14.1% to 13.4% overall.

African American Male Unemployment: 14.2%

African American Female Unemployment: 10.9%

African American Teenage Unemployment: 36.7%

African American Male Participation: 67.0%

African American Female Participation: 62.0%

African American Teenage Participation: 29.0%

Analysis: All three subgroups saw declines in their unemployment rates in September. The men and women saw negligible declines as the teenage subgroup was the driving force behind the big decline in African America’s unemployment rate. As with the country as a whole part-time jobs make up the bulk of the reason for the decline in the unemployment rate carried primarily by the teenage subgroup. Participation rates for men and women both declined while the teenage subgroup saw a bounce back in participation to its July levels after a significant decline in August.

Conclusion: There is very little to get excited about looking at the numbers for African America. The unemployment rate is down but so is the participation rate for the men and women’s groups. The rebound of teenage participation, which is in constant crisis itself, for African America masked the participation drop of the adult declines. An unsettling thought when you realize they are also the lowest wage earners in an already vastly under earning African America.

Source: Department of Labor