
Demographics matter. We take a look at which HBCU territories have the largest African American populations by percentage of total population.
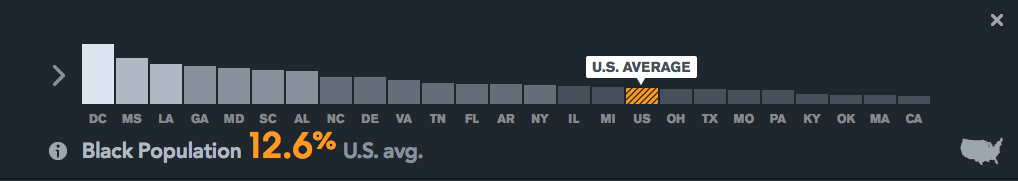
Washington D.C. – 49.5%
Mississippi – 37.6%
Louisiana – 32.2%
Georgia – 30.9%
Maryland – 29.2%
South Carolina – 27.7%
Alabama – 26.5%
North Carolina – 21.6%
Delaware – 21.5%
Virginia – 19.3%
Tennessee – 16.9%
Florida – 16.1%
Arkansas – 15.7%
New York – 15.6%
Illinois – 14.4%
Ohio – 12.2%
Texas – 11.9%
Missouri – 11.5%
Pennsylvania – 11%
Kentucky – 7.9%
Oklahoma – 7.2%
Massachusetts – 7.1%
California – 6%
