Category Archives: Economics

African America’s April Unemployment Report – 11.6%

jobs_pic

Overall Unemployment: 6.3% (6.7%)

African America Unemployment: 11.6% (12.4%)

Latino America Unemployment: 7.3% (7.9%)

European America Unemployment: 5.3% (5.8%)

Asian America Unemployment: 5.7% (5.4%)

Previous month in parentheses.

Analysis: The overall unemployment saw a decrease of 40 basis points. Asian America was the only group to see an increase in its unemployment rate with an increase of 30 basis points. African, European, and Latino America all saw declines in their unemployment rates at 80, 50, and 60 basis points, respectively. African America remains only group with double digit unemployment.

African American Male Unemployment: 10.8% (12.1%)

African American Female Unemployment: 10.4% (11.0%)

African American Teenage Unemployment: 36.8% (36.1%)

African American Male Participation: 66.4% (67.0%)

African American Female Participation: 61.7% (62.0%)

African American Teenage Participation: 27.9% (25.6%)

Previous month in parentheses.

Analysis: African American male and females both saw declines in their unemployment rates at 130 and 60 basis point drops, respectively. African American teenagers saw an increase of 70 basis points. Participation rates for the male and female groups both saw declines at 60 and 30 basis points, respectively. The teenage group saw an increase of 230 basis points.

Conclusion: The overall economy added 288 000 jobs in the month of April. An increase of 96 000 jobs from March and higher than economists consensus expectations. African America added 119 000 jobs, marking its largest job increase in the past five months. Even with the increase in jobs it comes with some pause. The participation rate can not seem to break out of its band and experienced a drop despite the increase in jobs. There is obvious optimism in the African American economy, but there is not enough of a trend to know if this momentary increase will sustain itself. This is particularly of concern with the government jobs continuing to shrink, where African America is overly dependent on the public sector. Government jobs are at its lowest mark since the recession began and of worth note to continue to watch.

Government Should Finance Growth Through Savings Not Borrowing

By William A. Foster, IV

It took thrift and savings, together with tremendous character and vision, to make our nation what it is today. And it will take thrift and savings, together with constant ingenuity and stamina, to conserve our remaining resources to enable us to continue to be a great nation. — John W. Snyder

Imagine for a moment you were superman/woman. Would you ever walk? Or drive? Or better yet, catch a flight to get anywhere? Of course you would not because you do not have to. You are faster than a speeding bullet  and have the ability to do something that nobody else does – for better or worse. This is the mentality of many governments on the face of the Earth – and maybe on other planets. Too often just because we can, we do.

I am residing in Houston, Texas at the moment. A place that as a whole has been largely insulated from the great recession due to its strict borrowing regulations on real estate and conservative rise in real estate prices which limit the amount of speculating that drowned the rest of the country. As a result of a stronger economy than the rest of the country, there were a large number of bond votes that Houstonians voted for or against in the past few years. Recently, a survey was done on how Houstonians felt about their financial future and it came back so positive that many bonds passed with relative ease. Yet, one has to ponder even for a city so highly insulated from the real estate bubble, but potentially vulnerable to the energy industry is there an unforeseen danger to constant leveraging of tomorrow today. Just ask Detroit.

A government bond is essentially a debt instrument that governments can use to bridge the gap between their tax revenues and their expenditures. These expenditures can include everything from paying employees, funding retirements, improving infrastructure, and a host of other things. On the states level many state constitutions require a balanced budget meaning states can not spend more than they take in a fiscal cycle. This is sometimes misleading as with most things in life there are loopholes. However, at the federal level though there is no mandate to have a balanced budget. The federal government can run deficits meaning it can spend more than it takes in by simply borrowing the margin it needs. I sure wish I had this option in my household, do not you? At the moment that gap (deficit) is annually running at about $1 trillion dollars which has helped create a national debt of approximately $16 trillion. Usually when a household, company, or organization runs a deficit for a prolonged period of time they end up in bankruptcy. The federal government though has the power of the purse meaning they can either print more money or increase taxes, but even this has its limits. That is because it can only work so long as there is an agreeable buyer to buy the debt as an investment.

Screen shot 2014-04-13 at 5.49.18 PM

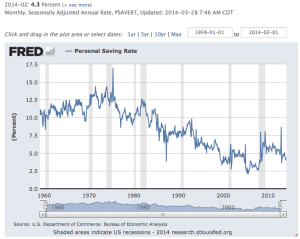
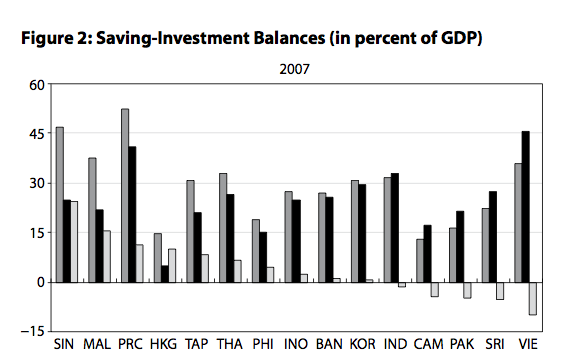
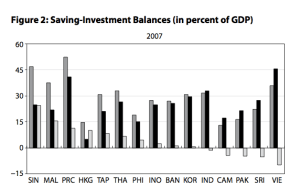
America’s culture of borrow, borrow, and borrow some more is a recent phenom in America seemingly ushered in with the rise of the Baby Boomer generation to power as you can see in the graph above over the past 60 years or so. Americans use to be more prudent savers prior to World War II. In stark contrast, Asia has and continues to be an increasingly acute saving society. The Asian Development Bank studied 14 Asian countries and the Chinese territory of Hong Kong and found their average savings rate to be 29.3 percent (see below) across the continent in its most recent data. Meanwhile, the United States current savings rate according to the St. Louis Fed shows America at 4.3 percent. In other words, it would take a 582 percent increase in America’s current savings rate to match Asia.  We know as the people’s behavior goes so goes their government’s. After all, governments are of the people and so is their fiscal behavior.

Screen shot 2014-04-13 at 5.46.31 PM

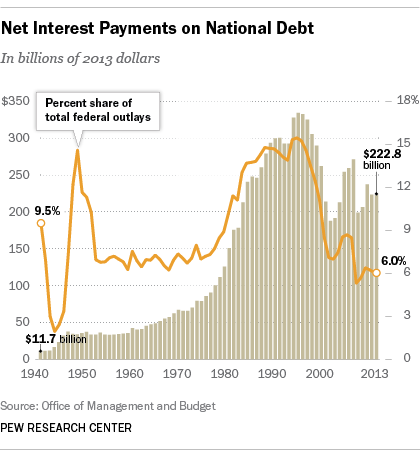
For some reason it has never dawned on governments to plan ahead. It has never dawned on them that debt to finance future purchases is not actually necessary. America’s current infrastructure is in disarray to put it kindly, but when these structures were built did no one think that one day they would decay? The moment we buy a car are we assuming it will run forever? Or it will never need maintenance? Instead, we have taken the attitude that these deferred maintenance or replacement cost can just be borrowed against more and more. Each time requiring more debt than previously borrowed and deferring the liability to another generation. Historically low interest rates are currently suppressing the net interest we are paying on our $17 trillion in debt. As of 2013, we are paying $223 billion in interest or 6 percent of federal outlays. Internal HBCU Money calculations estimate the percentage would be 59 percent of federal outlays or $10 trillion if the Fed funds rate adjusted to market demand.

The American Society of Civil Engineers gave the U.S. a D+ on its infrastructure and estimates it would cost $1.6 trillion to “catch up” by 2020. My elementary math might be a bit rusty, but that equates to currently seven years of interest. I could go on and on about the many number of things America could be doing with that $223 billion like improving our education system, providing more assistance for veterans, or simply putting that money away for a rainy day.

debt_interest2

There is joy in taking a walk, taking a country drive, and even in letting someone else do the flying and looking out of the window at the Earth’s beauty. Financial stress even at the most macro level of government seeps into American households and stresses the very fabric of a country. We see this with the rise of the TEA party and Occupy Wall Street movements. A change in culture is needed and it is needed within our homes. We must be fiscally responsible and teach our children to do the same so that the future generations of leadership in this country can start to remove the glutton of entitlement corrupting the veins of America. A family, community, country must be strong and part of that strength is its fiscal house or as my mother often told me – just because we can do something does not mean we should, superman. There is after all strength in restraint.

African America’s March Unemployment Report – 12.4%

jobs_pic

Overall Unemployment: 6.7% (6.7%)

African America Unemployment: 12.4% (12.0%)

Latino America Unemployment: 7.9% (8.1%)

European America Unemployment: 5.8% (5.8%)

Asian America Unemployment: 5.4% (6.0%)

Previous month in parentheses.

Analysis: Overall the unemployment rate went unchanged. Asian and Latino America both saw declines in their unemployment rates of 60 and 20 basis points, respectively. European America went unchanged. African America saw an increase of 40 basis points and remains the only group with double digit unemployment rate.

African American Male Unemployment: 12.1% (12.9%)

African American Female Unemployment: 11.0% (9.9%)

African American Teenage Unemployment: 36.1% (32.4%)

African American Male Participation: 67.0% (66.6%)

African American Female Participation: 62.0% (61.9%)

African American Teenage Participation: 25.6% (24.9%)

Previous month in parentheses.

Analysis: African American male unemployment saw a decline of 80 basis points, but females and teenagers both saw significant increases of 110 and 370 basis points, respectively. Participation rates for all three groups saw increases in their participation rates.

Conclusion: The overall economy added 192 000 jobs. An increase of 17 000 over February’s numbers, but still short of the majority of economist estimates. A sluggish effect from the winter storms appears to be still dragging. African America added 21 000 jobs for March. The number of employed African Americans and participation rate is at its highest in the past five months. African America’s labor force is at its highest number in the past five months, but so is the number of unemployed. Both of these factors have a significant factor on increasing the unemployment rate. There is renewed optimism for African American job seekers, but it would take an increase of 462 000 new jobs just for African America to get its unemployment rate under 10 percent at the current labor force numbers. An amount well over 100 percent above what the entire country is currently producing. This is also the smallest number of jobs African America has added in the past five months so even though most of the marks looks good, it appears to be more like the best sweater in an ugly sweater party.

African America’s February Unemployment Report – 12.0%

jobs_pic

Overall Unemployment: 6.7% (6.6%)

African America Unemployment: 12.0% (12.1%)

Latino America Unemployment: 8.1% (8.4%)

European America Unemployment: 5.8% (5.7%)

Asian America Unemployment: 6.0% (4.8%)

Previous month in parentheses.

Analysis: Overall unemployment rate rose 10 basis points. Both African America and Latino America saw declines in their unemployment rates of 10 and 30 basis points, respectively. Asian and European America saw increases of 120 and 10 basis points, respectively. With such a dramatic rise in Asian America’s unemployment rate, for the first time in a long time, European America now has the lowest unemployment rate in the country. African America remains the only group with a double digit unemployment rate.

African American Male Unemployment: 12.9% (12.0%)

African American Female Unemployment: 9.9% (10.4%)

African American Teenage Unemployment: 32.4% (38.0%)

African American Male Participation: 66.6% (66.2%)

African American Female Participation: 61.9% (61.5%)

African American Teenage Participation: 24.9% (26.4%)

Previous month in parentheses.

Analysis: Unemployment rates for females and teenagers saw declines of 50 and 560 basis points, respectively. Males saw an increase of 90 basis points in their unemployment rate. Participation rates for both males and females increased by 40 basis points for both groups. The teenage group saw its participation rate drop by 150 basis points.

Conclusion: The overall economy added 175 000 jobs. African America picked up 106 000 jobs. The female and teenage groups both netted positive job gains with the groups picking up 106 000 and 12 000 jobs, respectively. African American males lost 14 000 jobs, but still hold on to their second highest number of employed in the past five months. Unfortunately, the employment-population ratio is at its lowest in the past five months as well. African American women broke out hitting five month highs in participation rate, employment-population ratio, and number of employed. As a group, African American women continue to shoulder the burden of income and labor in African America. This month has the largest gap between the male-female employed numbers, with women holding 1.3 million more jobs. The teenage group sees a significant drop in its unemployment rate, but sees its labor force at its lowest in five months, its employed numbers at its second lowest, and participation rate at its lowest as well over the past five months. Overall, African American employment is at its highest mark in the past five months, but it is completely relying on the shoulders of the female group as the male and teenage groups continue to be frozen out of employment.

African America’s January Unemployment Report – 12.1%

jobs_pic

Overall Unemployment: 6.6% (6.7%)

African America Unemployment: 12.1% (11.9%)

Latino America Unemployment: 8.4% (8.3%)

European America Unemployment: 5.7% (5.9%)

Asian America Unemployment: 4.8% (4.1%)

Previous month in parentheses.

Analysis: Overall unemployment dropped 10 basis points. European America is the only group who saw their unemployment rate decline among all groups. Asian America had the largest increase among all groups. African American remains the only group with double digit unemployment rate.

African American Male Unemployment: 12.0% (11.5%)

African American Female Unemployment: 10.4% (10.4%)

African American Teenage Unemployment: 38.0% (35.5%)

African American Male Participation: 66.2% (65.6%)

African American Female Participation: 61.5% (61.2%)

African American Teenage Participation: 26.4% (27.4%)

Previous month in parentheses.

Analysis: A positive gain in participation rate for both men and women groups. Unemployment rates rose for both men and teenager groups. The teenager group hit a new low in their participation rate in the rolling past five months.

Conclusion: The overall economy added 113 000 jobs. Dubbed another disappointing month by economist as it missed estimates. African America’s labor force rose to its second largest number in the past five months increasing by 157 000 showing potential optimism brewing. However, only 95 000 jobs were added keeping the overall participation rate for African America at its second lowest over the past rolling five months. The participation rate for women remains virtually unchanged over the past rolling five months. African American men are at the second lowest participation rate in the past rolling five months. The good news, men and women have the largest employed population over the past rolling five months coupled with budding optimism for the adult population. African America’s employment issues just can not seem to find stable footing for long enough to make any dent. We are not back treading at the moment, but we are certainly not making any progress.