Category Archives: Economics

Unemployment Rate By HBCU State – March 2015

Screen Shot 2015-05-11 at 10.57.26 PM

STATES WITH RISING UNEMPLOYMENT: 7

STATES WITH DECLINING UNEMPLOYMENT: 13

STATES WITH UNCHANGED UNEMPLOYMENT: 4

MEDIAN UNEMPLOYMENT (HBCU TERRITORIES) – 5.6%

LOWEST: OKLAHOMA – 3.9%

HIGHEST – DISTRICT OF COLUMBIA – 7.7%

STATE – UNEMPLOYMENT RATE (PREVIOUS)*

ALABAMA –  5.7% (5.8%)

ARKANSAS – 5.6% (5.5%)

CALIFORNIA – 6.5% (6.7%)

DELAWARE – 4.6% (4.8%)

DISTRICT OF COLUMBIA – 7.7% (7.8%)

FLORIDA – 5.7% (5.6%)

GEORGIA – 6.3% (6.3%)

ILLINOIS – 6.0% (6.0%)

KENTUCKY – 5.1% (5.2%)

LOUISIANA – 6.6% (6.7%)

MARYLAND – 5.4% (5.5%)

MASSACHUSETTS – 4.8% (4.9%)

MICHIGAN – 5.6% (5.9%)

MISSISSIPPI – 6.8% (7.0%)

MISSOURI –  5.6% (5.5%)

NEW YORK – 5.7% (5.8%)

NORTH CAROLINA – 5.4% (5.3%)

OHIO – 5.1% (5.1%)

OKLAHOMA – 3.9% (3.9%)

PENNSYLVANIA – 5.3% (5.2%)

SOUTH CAROLINA – 6.7% (6.6%)

TENNESSEE – 6.3% (6.6%)

TEXAS – 4.2% (4.3%)

VIRGINIA – 4.8% (4.7%)

*Previous month in parentheses.

African America’s April Jobs Report – 9.6%

jobs

Overall Unemployment: 5.4% (5.5%)

African America Unemployment: 9.6% (10.1%)

Latino America Unemployment: 6.9% (6.8%)

European America Unemployment: 4.7% (4.7%)

Asian America Unemployment: 4.4% (3.2%)

Previous month in parentheses.

Analysis: Overall the unemployment rate dropped by 10 basis points. Asian America saw a significant rise of 120 basis points. Latino America saw a negligible rise of 10 basis points, while European America went unchanged. African American was the only group with a decline which constituted a 50 basis point drop.

African American Male Unemployment: 9.2% (10.0%)

African American Female Unemployment: 8.8% (9.2%)

African American Teenage Unemployment: 27.5% (25.0%)

African American Male Participation: 68.7% (67.2%)

African American Female Participation: 61.9% (61.4%)

African American Teenage Participation: 27.2% (25.7%)

Previous month in parentheses.

Analysis: African American males saw a 80 basis point drop in their unemployment rate and 150 basis point increase in their participation rate. African American females saw a 40 basis point drop in their unemployment rate and a 50 basis point increase in their participation rate. African American teenagers saw a 250 basis point increase in their unemployment rate and 150 basis point increase in their participation rate.

CONCLUSION: The overall economy added 223 000 jobs in April. African America added 400 000 jobs in April. The largest job increase since HBCU Money started tracking the data. Wages also saw an important uptick of 2.2 percent. The wage increase is expected to continue if the labor supply continues to shrink forcing companies and organizations into competition over limited labor supply. What remains uncertain is what drove such an outsized employment increase after an abysmal 7 000 jobs added the month before. If nothing it continues to show that African America’s employment condition will continue on a roller coaster of a ride.

The US Savings Rate Under Each President Since Ronald Reagan (Charts)

There has always been something of a fractured truth about the president’s role in the economy and wealth of the United States. Like a quarterback in the NFL, when things go right they get too much of the credit and when things go wrong they get too much of the blame. Because economic policies tend to lag most presidents spend their first term under the echoes of the previous president’s economic policies and not until their second term (if they get one) do you see potentially their own policies being felt. Never mind the impact that Congress also plays in setting economic rules and regulations, especially as it relates to the tax code. Lastly, the greatest wielder of any economy is the central bank or in this case the Federal Reserve. Unfortunately, we often force our perception to be reality.

In good times, Americans have notoriously under saved and conversely in bad times find it hard too save. Culturally, Americans have never been a country of savers. Some argue this has been a result more and more in recent generations of the societal safety nets in place that discourages savings behavior. There is some truth to this when you see countries in Asia where savings rates can be upwards of 30 percent arguably because there is no social security or government assistance of any sort if something were to happen. How a culture views debt and values possession can have an acute influence on households emphasis on savings.

So what exactly is the savings rate? Investopedia defines the savings rate as, “The amount of money, expressed as a percentage or ratio, that one deducts from his/her disposable personal income to set aside as a nest egg or for retirement. The cash accumulated is typically put into very low-risk investments (depending on various factors such as expected time until retirement), like a money market fund or a personal IRA comprised of non-aggressive mutual funds, stocks and bonds.” No president over the past 35 years has enjoyed a higher savings rate than Ronald Reagan at 12.7 percent and no president has enjoyed a lower savings rate than George W. Bush at 1.9 percent. Both, largely could be explained by the aforementioned Federal Reserve policy of interest rate movement. The Federal Reserve during Reagan’s tenure held interest rates in the healthy double digits, while the Federal Reserve during George W. Bush’s tenure in office were pushed toward near zero.

RONALD REAGAN (1/20/1981 – 1/20/1989)

Highest – 12.7% (November 1981)

Screen Shot 2015-05-01 at 5.47.31 PM

Lowest – 3.8% (April 1987)

Screen Shot 2015-05-01 at 5.47.39 PM

GEORGE H.W. BUSH (1/20/1989 – 1/20/1993)

Highest – 9.9% (December 1992)

Screen Shot 2015-05-01 at 5.50.12 PM

Lowest – 7.1% (August 1989) Screen Shot 2015-05-01 at 5.49.59 PM

BILL CLINTON (1/20/1993 – 1/20/2001)

Highest – 8.4% (December 1993)

Screen Shot 2015-05-05 at 5.51.26 PM

Lowest – 3.5% (December 2000)

Screen Shot 2015-05-01 at 5.51.09 PM

gEORGE w. BUSH (1/20/2001 – 1/20/2009)

Highest – 7.9% (May 2008)

Screen Shot 2015-05-01 at 5.52.20 PM

Lowest – 1.9% (July 2005)

Screen Shot 2015-05-01 at 5.52.38 PM

BARACK OBAMA (1/20/2009 – Present)

Highest – 10.5% (December 2012) Screen Shot 2015-05-01 at 5.53.38 PM

Lowest – 4.1% (December 2013)

Screen Shot 2015-05-01 at 5.53.27 PM

Source: St. Louis Fed

Unemployment Rate By HBCU State – February 2015

Screen Shot 2015-04-13 at 9.45.04 AM

STATES WITH RISING UNEMPLOYMENT: 2

STATES WITH DECLINING UNEMPLOYMENT: 15

STATES WITH UNCHANGED UNEMPLOYMENT: 7

MEDIAN UNEMPLOYMENT (HBCU TERRITORIES) – 5.6%

LOWEST: OKLAHOMA – 3.9%

HIGHEST – DISTRICT OF COLUMBIA – 7.8%

STATE – UNEMPLOYMENT RATE (PREVIOUS)*

ALABAMA –  5.8% (6.0%)

ARKANSAS – 5.5% (5.6%)

CALIFORNIA – 6.7% (6.9%)

DELAWARE – 4.8% (5.0%)

DISTRICT OF COLUMBIA – 7.8% (7.7%)

FLORIDA – 5.6% (5.7%)

GEORGIA – 6.3% (6.4%)

ILLINOIS – 6.0% (6.1%)

KENTUCKY – 5.2% (5.5%)

LOUISIANA – 6.7% (7.0%)

MARYLAND – 5.5% (5.5%)

MASSACHUSETTS – 4.9% (5.1%)

MICHIGAN – 5.9% (6.3%)

MISSISSIPPI – 7.0% (7.1%)

MISSOURI –  5.5% (5.5%)

NEW YORK – 5.8% (5.8%)

NORTH CAROLINA – 5.3% (5.4%)

OHIO – 5.1% (5.1%)

OKLAHOMA – 3.9% (3.9%)

PENNSYLVANIA – 5.2% (5.1%)

SOUTH CAROLINA – 6.6% (6.6%)

TENNESSEE – 6.6% (6.7%)

TEXAS – 4.3% (4.4%)

VIRGINIA – 4.7% (4.7%)

*Previous month in parentheses.

African America’s March Jobs Report – 10.1%

jobs

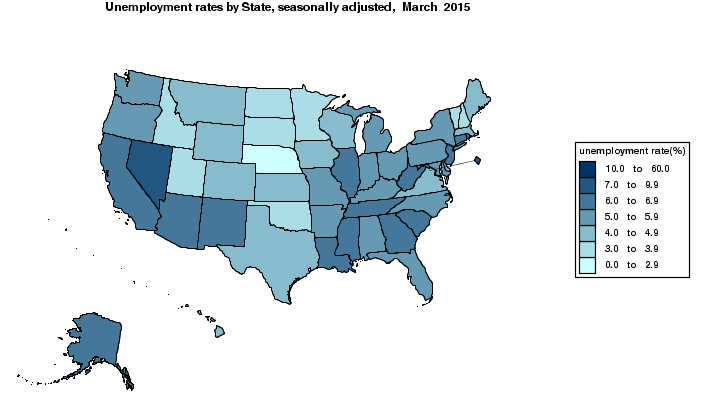
Overall Unemployment: 5.5% (5.5%)

African America Unemployment: 10.1% (10.4%)

Latino America Unemployment: 6.8% (6.6%)

European America Unemployment: 4.7% (4.7%)

Asian America Unemployment: 3.2% (4.0%)

Previous month in parentheses.

Analysis: Overall the unemployment rate went unchanged. Latino America was the only group with a rising unemployment rate of 20 basis points. Asian America retains America’s lowest unemployment rate, tightening an even firmer grip with an 80 basis point drop. African America saw a decrease of 40 basis points and remains the only group with double digit unemployment.

African American Male Unemployment: 10.0% (10.4%)

African American Female Unemployment: 9.2% (8.9%)

African American Teenage Unemployment: 25.0% (30.0%)

African American Male Participation: 67.2% (67.3%)

African American Female Participation: 61.4% (61.3%)

African American Teenage Participation: 25.7% (29.1%)

Previous month in parentheses.

Analysis: African American males saw a 40 basis point decline in unemployment and a 10 basis point drop in participation rate. African American females experienced a rise in their unemployment rate 30 basis points, but maintain their single digit unemployment rate. They also got an uptick in their participation rate 10 basis points. African American teenagers had their unemployment rate decline by 500 basis points, but also their participation rate dropped a precipitously 340 basis points.

CONCLUSION: The overall economy added 126 000 jobs in March. Wages also saw a slight increase of 0.3 percent, overall. After a year of average job gains for the country at almost 270 000 jobs per month, this marks an over 50 percent decline and sparks concern among many economist. African America added only 7 000 jobs, bringing four straight months of five figure job gains to a screeching halt. The albatross are the teenagers who took a massive hit in employed numbers and their participation rate, dragging down the overall group. At current labor force levels, African America needs 40 000 jobs to obtain 9.9 percent unemployment. With weakening economy data that maybe harder to accomplish as growth both domestically and internationally appears to be grinding along.