Tag Archives: jobs

African America’s June Jobs Report – 7.1%

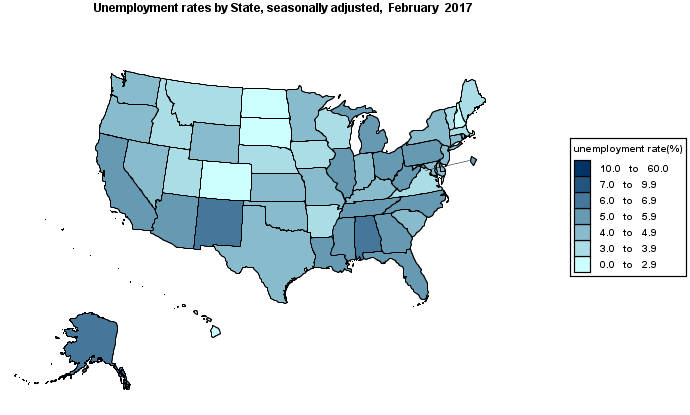
Overall Unemployment: 4.4% (4.3%)

African America Unemployment: 7.1% (7.5%)

Latino America Unemployment: 4.8% (5.2%)

European America Unemployment: 3.8% (3.7%)

Asian America Unemployment: 3.6% (3.6%)

Previous month in parentheses.

Analysis: Overall unemployment rose 10 basis points. This was a rise from the lowest levels since May 2001. African and Latino America dropped 40 basis points, while Asian and European America were negligible in their change.

African American Male Unemployment: 6.3% (6.5%)

African American Female Unemployment: 6.8% (7.0%)

African American Teenage Unemployment: 21.1% (27.3%)

African American Male Participation: 67.5% (67.5%)

African American Female Participation: 62.4% (62.9%)

African American Teenage Participation: 30.8% (31.3%)

Analysis: All three African American groups saw decreases in their unemployment rate, but it was the Teenage group who led the way with an astounding 620 basis point drop. Participation rates though for women and teenagers both declining, while the men had no change.

African American Male-Female Job Gap: 945 000 jobs (1 038 000 jobs)

CONCLUSION: The overall economy added 222 000 jobs in June. This exceeded many economists expectations. African America saw a job increase came in at 16 000, a fourth straight month of job gains. However, job growth appears to be slowing after two months ago coming in at 100 000 and the month prior being at 46 000. Still this is the highest number of employed that African America has seen overall in sometime. Explaining job growth for the country let alone African America at this point has reached a guessing game for many economists. The participation rates continue to be a concern overall, especially among men who continue to see their number slide and women’s participation rate remains erratic at best.

African America currently needs 608 000 jobs to match America’s unemployment rate. A decrease of 108 000 from May.

Unemployment Rate By HBCU State – April 2017

STATES WITH RISING UNEMPLOYMENT: 6

STATES WITH DECLINING UNEMPLOYMENT: 11

STATES WITH UNCHANGED UNEMPLOYMENT: 7

LOWEST: ARKANSAS – 3.5%

HIGHEST: DISTRICT OF COLUMBIA – 5.9%

STATE – UNEMPLOYMENT RATE (PREVIOUS)*

ALABAMA –  5.4% (5.8%)

ARKANSAS – 3.5% (3.6%)

CALIFORNIA – 4.8% (4.9%)

DELAWARE – 4.6% (4.5%)

DISTRICT OF COLUMBIA – 5.9% (5.8%)

FLORIDA – 4.5% (4.8%)

GEORGIA – 5.0% (5.1%)

ILLINOIS – 4.7% (4.9%)

KENTUCKY – 5.1% (5.0%)

LOUISIANA – 5.8% (5.7%)

MARYLAND – 4.3% (4.3%)

MASSACHUSETTS – 3.9% (3.6%)

MICHIGAN – 4.7% (5.1%)

MISSISSIPPI – 5.0% (5.0%)

MISSOURI –  3.9% (3.9%)

NEW YORK – 4.3% (4.3%)

NORTH CAROLINA – 4.7% (4.9%)

OHIO – 5.0% (5.1%)

OKLAHOMA – 4.3% (4.3%)

PENNSYLVANIA – 4.9% (4.8%)

SOUTH CAROLINA – 4.3% (4.4%)

TENNESSEE – 4.7% (5.1%)

TEXAS – 5.0% (5.0%)

VIRGINIA – 3.8% (3.8%)

*Previous month in parentheses.

African America’s May Jobs Report – 7.5%

Overall Unemployment: 4.3% (4.4%)

African America Unemployment: 7.5% (7.9%)

Latino America Unemployment: 5.2% (5.2%)

European America Unemployment: 3.7% (3.8%)

Asian America Unemployment: 3.6% (3.2%)

Previous month in parentheses.

Analysis: Overall unemployment dropped by 10 basis points to a 16 year low. African America dropped by 40 basis points, the largest drop among all groups. Asian America saw a 40 basis point increase, but remains lowest among all groups. European and Latino America had negligible change.

African American Male Unemployment: 6.5% (7.3%)

African American Female Unemployment: 7.0% (6.9%)

African American Teenage Unemployment: 27.3% (29.3%)

African American Male Participation: 67.5% (68.3%)

African American Female Participation: 62.9% (62.7%)

African American Teenage Participation: 31.3% (30.8%)

Analysis: African American Males had a 80 basis point drop in their unemployment and participation rate. This after three months straight of participation rate growth. African American Females had a slight uptick in unemployment and participation rates. Their participation rate has been virtually unchanged for the past five months. African American Teenagers had a 200 basis point decrease in unemployment rate and 30 basis point increase in their participation as they post a five month high in jobs.

African American Male-Female Job Gap: 1 038 000 jobs (974 000 jobs)

CONCLUSION: The overall economy added 138 000 jobs in May. This is versus an expected 185 000 by surveyed economists. African America saw an increase of 46 000 jobs, but quite a pullback after over 100 000 jobs in April. Despite strong numbers, many can not help but feel apprehensive about the economy’s sluggishness. An expected rate hike in June is still on the table, but it is less certain after two months straight of missed expectations. African America continues to push forward under the Trump administration with its highest employed numbers seeing an increase every month thus far. We know the economy is overdue for a recession, but it is by no means overheated leaving most economist in unfamiliar territory of just what happens going forward.

African America currently needs 717 000 jobs to match America’s unemployment rate. A increase of 4 000 from April.


Unemployment Rate By HBCU State – March 2017

STATES WITH RISING UNEMPLOYMENT: 5

STATES WITH DECLINING UNEMPLOYMENT: 16

STATES WITH UNCHANGED UNEMPLOYMENT: 3

LOWEST: ARKANSAS & MASSACHUSETTS – 3.6%

HIGHEST: ALABAMA & DISTRICT OF COLUMBIA – 5.8%

STATE – UNEMPLOYMENT RATE (PREVIOUS)*

ALABAMA –  5.8% (6.2%)

ARKANSAS – 3.6% (3.7%)

CALIFORNIA – 4.9% (5.0%)

DELAWARE – 4.5% (4.5%)

DISTRICT OF COLUMBIA – 5.8% (5.7%)

FLORIDA – 4.8% (5.0%)

GEORGIA – 5.1% (5.3%)

ILLINOIS – 4.9% (5.4%)

KENTUCKY – 5.0% (4.9%)

LOUISIANA – 5.7% (5.8%)

MARYLAND – 4.3% (4.2%)

MASSACHUSETTS – 3.6% (3.4%)

MICHIGAN – 5.1% (5.3%)

MISSISSIPPI – 5.0% (5.2%)

MISSOURI –  3.9% (4.1%)

NEW YORK – 4.3% (4.4%)

NORTH CAROLINA – 4.9% (5.1%)

OHIO – 5.1% (5.1%)

OKLAHOMA – 4.3% (4.6%)

PENNSYLVANIA – 4.8% (5.0%)

SOUTH CAROLINA – 4.4% (4.4%)

TENNESSEE – 5.1% (5.3%)

TEXAS – 5.0% (4.9%)

VIRGINIA – 3.8% (3.9%)

*Previous month in parentheses.

Unemployment Rate By HBCU State – February 2017

STATES WITH RISING UNEMPLOYMENT: 5

STATES WITH DECLINING UNEMPLOYMENT: 15

STATES WITH UNCHANGED UNEMPLOYMENT: 4

LOWEST: MASSACHUSETTS – 3.4%

HIGHEST – ALABAMA – 6.2%

STATE – UNEMPLOYMENT RATE (PREVIOUS)*

ALABAMA –  6.2% (6.4%)

ARKANSAS – 3.7% (3.8%)

CALIFORNIA – 5.0% (5.1%)

DELAWARE – 4.5% (4.4%)

DISTRICT OF COLUMBIA – 5.7% (5.7%)

FLORIDA – 5.0% (5.0%)

GEORGIA – 5.3% (5.5%)

ILLINOIS – 5.4% (5.7%)

KENTUCKY – 4.9% (5.0%)

LOUISIANA – 5.8% (5.9%)

MARYLAND – 4.2% (4.2%)

MASSACHUSETTS – 3.4% (3.2%)

MICHIGAN – 5.3% (5.2%)

MISSISSIPPI – 5.2% (5.5%)

MISSOURI –  4.1% (4.2%)

NEW YORK – 4.4% (4.6%)

NORTH CAROLINA – 5.1% (5.3%)

OHIO – 5.1% (5.0%)

OKLAHOMA – 4.6% (4.7%)

PENNSYLVANIA – 5.0% (5.2%)

SOUTH CAROLINA – 4.4% (4.4%)

TENNESSEE – 5.3% (5.4%)

TEXAS – 4.9% (4.8%)

VIRGINIA – 3.9% (4.0%)

*Previous month in parentheses.