
October 2014 Average Earnings: $24.59
October 2015 Average Earnings: $25.20
Month Change: Up 0.04 Percent

October 2014 Average Earnings: $24.59
October 2015 Average Earnings: $25.20
Month Change: Up 0.04 Percent

STATES WITH RISING UNEMPLOYMENT: 1
STATES WITH DECLINING UNEMPLOYMENT: 19
STATES WITH UNCHANGED UNEMPLOYMENT: 4
LOWEST: TEXAS – 4.1%
HIGHEST – DISTRICT OF COLUMBIA – 6.8%
ALABAMA – 6.0% (6.2%)
ARKANSAS – 5.2% (5.4%)
CALIFORNIA – 5.9% (6.1%)
DELAWARE – 4.9% (4.9%)
DISTRICT OF COLUMBIA – 6.7% (6.8%)
FLORIDA – 5.2% (5.3%)
GEORGIA – 5.8% (5.9%)
ILLINOIS – 5.4% (5.6%)
KENTUCKY – 5.0% (5.2%)
LOUISIANA – 6.0% (6.0%)
MARYLAND – 5.1% (5.1%)
MASSACHUSETTS – 4.6% (4.7%)
MICHIGAN – 5.0% (5.1%)
MISSISSIPPI – 6.1% (6.3%)
MISSOURI – 5.3% (5.6%)
NEW YORK – 5.1% (5.2%)
NORTH CAROLINA – 5.8% (5.9%)
OHIO – 4.5% (4.7%)
OKLAHOMA – 4.4% (4.6%)
PENNSYLVANIA – 5.3% (5.4%)
SOUTH CAROLINA – 5.7% (6.0%)
TENNESSEE – 5.7% (5.7%)
TEXAS – 4.2% (4.1%)
VIRGINIA – 4.3% (4.5%)
*Previous month in parentheses.

Overall Unemployment: 5.0% (5.1%)
African America Unemployment: 9.2% (9.2%)
Latino America Unemployment: 6.3% (6.4%)
European America Unemployment: 4.4% (4.4%)
Asian America Unemployment: 3.5% (3.6%)
Previous month in parentheses.
Analysis: Overall unemployment dropped 10 basis points in the month of October from the previous month. African and European American both saw unchanged unemployment rates. Asian and Latino America both saw decreases of 10 basis points.
African American Male Unemployment: 9.2% (8.9%)
African American Female Unemployment: 8.1% (8.0%)
African American Teenage Unemployment: 25.6% (31.5%)
African American Male Participation: 67.0% (66.9%)
African American Female Participation: 62.5% (62.1%)
African American Teenage Participation: 27.0% (28.7%)
Previous month in parentheses.
Analysis:African American males had a 30 basis point increase in their unemployment rate and a 10 basis point increase in their participation rate. African American females had a 10 basis point increase in their unemployment rate and a 40 basis point increase in their participation rate. African American teenagers unemployment rate declined 590 basis points and participation rate also experienced a decline of 170 basis points.
CONCLUSION: The overall economy added 271 000 jobs in October. African America added 47 000 jobs in October. African America’s economy is stagnant. Very little movement in key factors like the participation rate have basically gone unchanged the past five months. Despite this, the labor force continues to see a steady increase the past five months. Going into the holiday season should be helpful to seasonal hiring and improve the employment numbers. African American needs an increase of 817 000 jobs to match the country’s unemployment rate. An increase of 15 000 from September’s number.
Posted in Economics
Tagged african american unemployment rate, jobs, unemployment rate
Press release via Federal Reserve’s website and video from Chairwoman Janet Yellen’s press conference:
Information received since the Federal Open Market Committee met in July suggests that economic activity is expanding at a moderate pace. Household spending and business fixed investment have been increasing moderately, and the housing sector has improved further; however, net exports have been soft. The labor market continued to improve, with solid job gains and declining unemployment. On balance, labor market indicators show that underutilization of labor resources has diminished since early this year. Inflation has continued to run below the Committee’s longer-run objective, partly reflecting declines in energy prices and in prices of non-energy imports. Market-based measures of inflation compensation moved lower; survey-based measures of longer-term inflation expectations have remained stable.
Consistent with its statutory mandate, the Committee seeks to foster maximum employment and price stability. Recent global economic and financial developments may restrain economic activity somewhat and are likely to put further downward pressure on inflation in the near term. Nonetheless, the Committee expects that, with appropriate policy accommodation, economic activity will expand at a moderate pace, with labor market indicators continuing to move toward levels the Committee judges consistent with its dual mandate. The Committee continues to see the risks to the outlook for economic activity and the labor market as nearly balanced but is monitoring developments abroad. Inflation is anticipated to remain near its recent low level in the near term but the Committee expects inflation to rise gradually toward 2 percent over the medium term as the labor market improves further and the transitory effects of declines in energy and import prices dissipate. The Committee continues to monitor inflation developments closely.
To support continued progress toward maximum employment and price stability, the Committee today reaffirmed its view that the current 0 to 1/4 percent target range for the federal funds rate remains appropriate. In determining how long to maintain this target range, the Committee will assess progress–both realized and expected–toward its objectives of maximum employment and 2 percent inflation. This assessment will take into account a wide range of information, including measures of labor market conditions, indicators of inflation pressures and inflation expectations, and readings on financial and international developments. The Committee anticipates that it will be appropriate to raise the target range for the federal funds rate when it has seen some further improvement in the labor market and is reasonably confident that inflation will move back to its 2 percent objective over the medium term.
The Committee is maintaining its existing policy of reinvesting principal payments from its holdings of agency debt and agency mortgage-backed securities in agency mortgage-backed securities and of rolling over maturing Treasury securities at auction. This policy, by keeping the Committee’s holdings of longer-term securities at sizable levels, should help maintain accommodative financial conditions.
When the Committee decides to begin to remove policy accommodation, it will take a balanced approach consistent with its longer-run goals of maximum employment and inflation of 2 percent. The Committee currently anticipates that, even after employment and inflation are near mandate-consistent levels, economic conditions may, for some time, warrant keeping the target federal funds rate below levels the Committee views as normal in the longer run.
Voting for the FOMC monetary policy action were: Janet L. Yellen, Chair; William C. Dudley, Vice Chairman; Lael Brainard; Charles L. Evans; Stanley Fischer; Dennis P. Lockhart; Jerome H. Powell; Daniel K. Tarullo; and John C. Williams. Voting against the action was Jeffrey M. Lacker, who preferred to raise the target range for the federal funds rate by 25 basis points at this meeting.
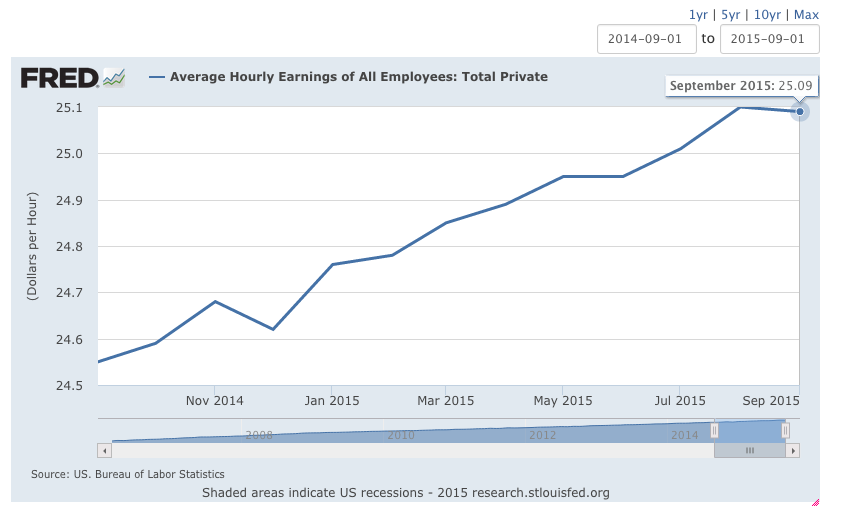
September 2014 Average Earnings: $24.55
September 2015 Average Earnings: $25.09
Month Change: Down 0.04 Percent
