Category Archives: Economics

Unemployment Rate By HBCU State – August 2015

Screen Shot 2015-10-06 at 12.37.50 PM

STATES WITH RISING UNEMPLOYMENT: 2

STATES WITH DECLINING UNEMPLOYMENT: 15

STATES WITH UNCHANGED UNEMPLOYMENT: 7

LOWEST: TEXAS – 4.1%

HIGHEST – DISTRICT OF COLUMBIA – 6.8%

STATE – UNEMPLOYMENT RATE (PREVIOUS)*

ALABAMA –  6.2% (6.2%)

ARKANSAS – 5.4% (5.6%)

CALIFORNIA – 6.1% (6.2%)

DELAWARE – 4.9% (4.7%)

DISTRICT OF COLUMBIA – 6.8% (6.8%)

FLORIDA – 5.3% (5.4%)

GEORGIA – 5.9% (6.0%)

ILLINOIS – 5.6% (5.8%)

KENTUCKY – 5.2% (5.2%)

LOUISIANA – 6.0% (6.2%)

MARYLAND – 5.1% (5.2%)

MASSACHUSETTS – 4.7% (4.7%)

MICHIGAN – 5.1% (5.3%)

MISSISSIPPI – 6.3% (6.5%)

MISSOURI –  5.6% (5.8%)

NEW YORK – 5.2% (5.4%)

NORTH CAROLINA – 5.9% (5.9%)

OHIO – 4.7% (5.0%)

OKLAHOMA – 4.6% (4.5%)

PENNSYLVANIA – 5.4% (5.4%)

SOUTH CAROLINA – 6.0% (6.4%)

TENNESSEE – 5.7% (5.7%)

TEXAS – 4.1% (4.2%)

VIRGINIA – 4.5% (4.8%)

*Previous month in parentheses.

African America’s September Jobs Report – 9.2%

jobs

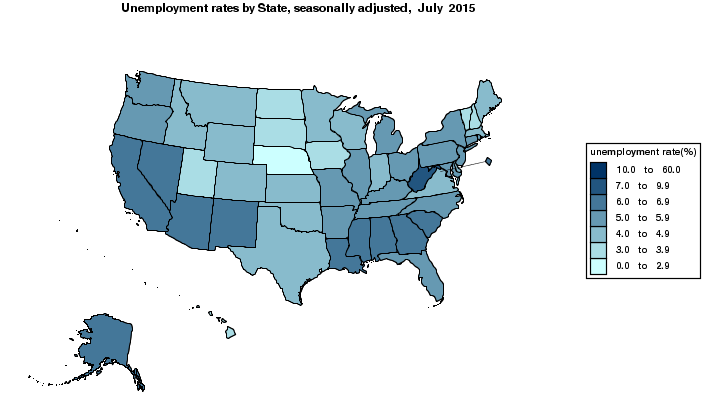
Overall Unemployment: 5.1% (5.1%)

African America Unemployment: 9.2% (9.5%)

Latino America Unemployment: 6.4% (6.6%)

European America Unemployment: 4.4% (4.4%)

Asian America Unemployment: 3.6% (3.5%)

Previous month in parentheses.

Analysis: Overall unemployment went unchanged in the month of September from the previous month. African America experienced the largest decrease with a 30 basis point decline, followed by Latino America with a 20 basis point decline. European America went unchanged for the second month in a row. Asian America experienced a slight uptick of 10 basis points.

African American Male Unemployment: 8.9% (9.2%)

African American Female Unemployment: 8.0% (8.1%)

African American Teenage Unemployment: 31.5% (31.3%)

African American Male Participation: 66.9% (67.1%)

African American Female Participation: 62.1% (62.5%)

African American Teenage Participation: 28.7% (27.8%)

Previous month in parentheses.

Analysis: African American males had a 30 basis point drop in their unemployment rate and 20 basis point decline in the participation rate. African American females had 10 basis point drop in their unemployment rate and 40 basis point decline in their participation rate. African American teenagers unemployment rate increased by 20 basis points and participation rate increased by 90 basis points.

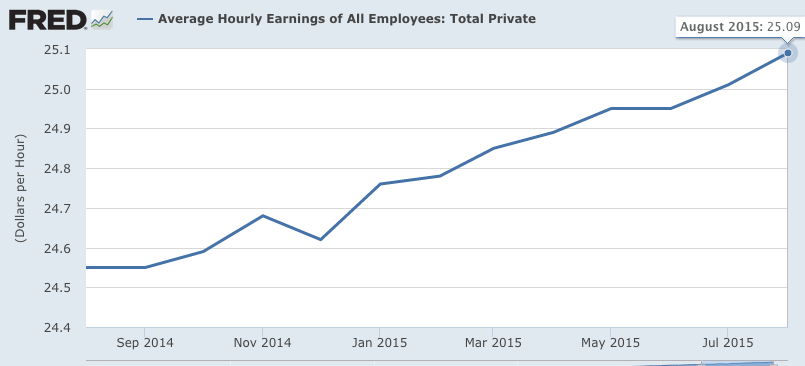
CONCLUSION: The overall economy added 142 000 jobs in September. African America added 4 000 jobs in September. African America continues to have a mixed bag of data. Number of employed are at a five month high, participation rate is at a five month low, and number of employed at a five month high. African American males have especially seen a hit of 160 basis point drop over the past five months in their participation rate. With a number of the country’s bellwether companies laying off workers ahead of a potential interest rate hike, this could see an acceleration in the unemployment increase in African America. African America currently needs 802 000 jobs to match the country’s unemployment rate.


August 2014 To August 2015 Average Earnings – Up 2.2 Percent

augustShot 2015-09-08 at 9.59.24 PM

August 2014 Average Earnings: $24.55

August 2015 Average Earnings: $25.09

Month Change: Up 0.32 Percent

Unemployment Rate By HBCU State – July 2015

Screen Shot 2015-09-07 at 4.11.30 PM

STATES WITH RISING UNEMPLOYMENT: 4

STATES WITH DECLINING UNEMPLOYMENT: 13

STATES WITH UNCHANGED UNEMPLOYMENT: 7

MEDIAN UNEMPLOYMENT (HBCU TERRITORIES) – 5.7%

LOWEST: TEXAS – 4.2%

HIGHEST – DISTRICT OF COLUMBIA – 6.8%

STATE – UNEMPLOYMENT RATE (PREVIOUS)*

ALABAMA –  6.2% (6.1%)

ARKANSAS – 5.6% (5.7%)

CALIFORNIA – 6.2% (6.3%)

DELAWARE – 4.7% (4.7%)

DISTRICT OF COLUMBIA – 6.8% (7.0%)

FLORIDA – 5.4% (5.5%)

GEORGIA – 6.0% (6.1%)

ILLINOIS – 5.8% (5.9%)

KENTUCKY – 5.2% (5.1%)

LOUISIANA – 6.2% (6.4%)

MARYLAND – 5.2% (5.2%)

MASSACHUSETTS – 4.7% (4.6%)

MICHIGAN – 5.3% (5.5%)

MISSISSIPPI – 6.5% (6.6%)

MISSOURI –  5.8% (5.8%)

NEW YORK – 5.4% (5.5%)

NORTH CAROLINA – 5.9% (5.8%)

OHIO – 5.0% (5.2%)

OKLAHOMA – 4.5% (4.5%)

PENNSYLVANIA – 5.4% (5.4%)

SOUTH CAROLINA – 6.4% (6.6%)

TENNESSEE – 5.7% (5.7%)

TEXAS – 4.2% (4.2%)

VIRGINIA – 4.8% (4.9%)

*Previous month in parentheses.

African America’s August Jobs Report – 9.5%

jobs

Overall Unemployment: 5.1% (5.3%)

African America Unemployment: 9.5% (9.1%)

Latino America Unemployment: 6.6% (6.8%)

European America Unemployment: 4.4% (4.6%)

Asian America Unemployment: 3.5% (4.0%)

Previous month in parentheses.

Analysis: Overall unemployment neared the Federal Reserve’s full employment mandate after dropping another 20 basis points. Asian America led the way with a 50 basis point drop in unemployment rate. European and Latino America both saw 20 basis point declines. African America was the only group to see an increase in its unemployment rate with a 40 basis point increase.

African American Male Unemployment: 9.2% (8.8%)

African American Female Unemployment: 8.1% (8.0%)

African American Teenage Unemployment: 31.3% (28.7%)

African American Male Participation: 67.1% (67.0%)

African American Female Participation: 62.5% (62.1%)

African American Teenage Participation: 27.8% (28.1%)

Previous month in parentheses

Analysis: African American males unemployment rate increased by 40 basis points and 10 basis point increase in their participation rate. African American females had an increase in their unemployment rate of 10 basis points and 40 basis point increase in their participation rate. African American teenagers had a 260 basis point increase in their unemployment rate and 30 basis point decrease in their participation rate.

CONCLUSION: The overall economy added 173 000 jobs in August. African America added 22 000 jobs in August. While all other groups saw declines in their unemployment rate African America saw an uptick. This was largely due to an increase in the African American labor force by 100 000. Unfortunately, the increase was not matched by a parallel increase in jobs. The participation rate has gone virtually unchanged over the year although African American women have made significant strides in employment gains, currently at their highest number of employed. African American teenagers as a group continue to be in a state of crisis. The coming rate increase could see significant employment reductions across the board as public companies try to maintain their stock prices. Business creation remains the most viable option for dealing with the employment stagnation in African America, but limited resources make business creation and job expansion very limited. Currently, African America needs 844 000 jobs to match the nation’s unemployment rate.