Category Archives: Economics

The Lessons of Harvey: Businesses Need To Be Integrated Into City’s Emergency Plans

“As cities have grown rapidly across the nation, many have neglected infrastructure projects and paved over green spaces that once absorbed rainwater.” –  Charles Duhigg

By William A. Foster, IV

One of my favorite shows is Star Trek and one of the most memorable characters was from the Voyager series, Seven of Nine. She was a former Borg, a species that strived for perfection and efficiency. Despite being separated from the Borg, she remained rooted in their values of striving for perfection and efficiency. Humanity often is very reactive at times in its striving for efficiency. This is especially true when it comes to natural disasters. Often times when we think we are prepared for the absolute worse, Mother Nature says, “Hold my drink.” and proceeds to exceed even our expectations of just what is possible from her. Worst case scenarios by municipalities have been time and time again blown out of the water (no pun intended) over the past few decades as climate change appears to be bringing about more volatile natural disasters.

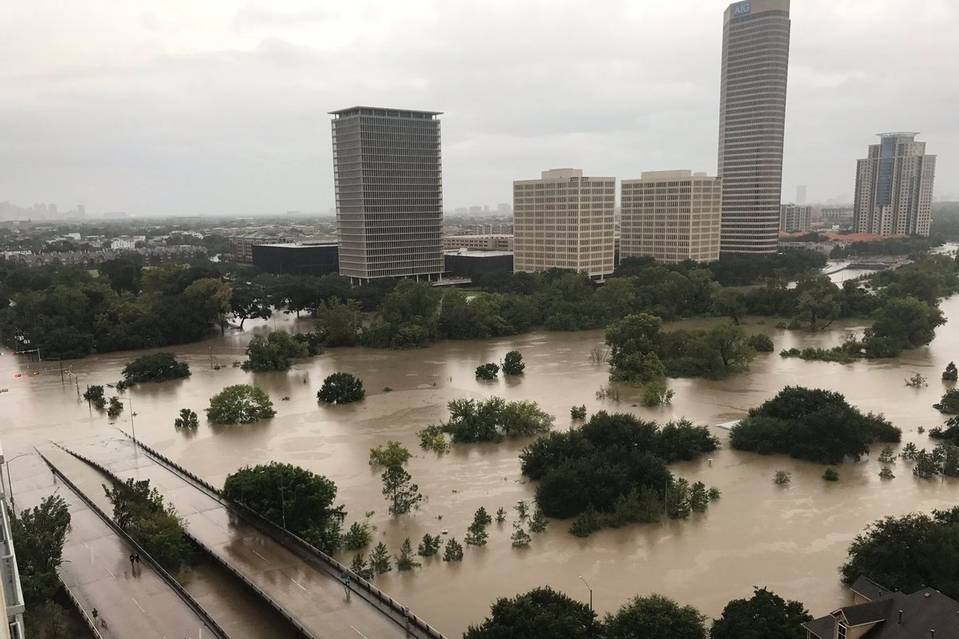
Over the past decade, Houston has seen a population boom since the Great Recession. While the rest of the country struggled Houston thrived and expanded almost 22 percent over the period thanks to triple digit oil prices. A construction boom inside Houston’s inner loop, historically a place most Houstonians avoided, took root. To the point, developers could not build fast enough for the population influx coming in from around the country. In the process though some serious infrastructure problems have started to arise. Houston was already notorious for flooding, now as developers took lots where once a single-family residence stood and put three to four townhouses on them, green space drastically reduced and the notorious flooding has become even worse with water having virtually nowhere to go. Enter, Harvey.

To be fair, Harvey is an unusual beast of spectacular fashion, although Irma may prove to be the start of a trend. Somewhere between 10-15 trillion gallons are what is expected to have dropped into the city of Houston after Hurricane and Tropical Storm Harvey was done. It is an unprecedented event for the fourth-largest city in the United States. To put it in perspective, imagine the entire state of Delaware which is comparable to Greater Houston’s almost 2300 square miles of geography, with six times the population being submerged under water. Greater Houston’s population is well over six million and the last time a mass evacuation was tried twelve years ago, more people died in the evacuation than in the actual storm. It would likely require Houston a week or two to have a calm organized evacuation that did not overwhelm the city and state’s highways and roads. And perhaps at this point, trying to evacuate people is just the wrong idea. There are so many logistical and socioeconomic problems with trying to do so, all one needs is to look back on Hurricane Katrina for a reality check of why it is nearly impossible to do so.

So how can a city like Houston and others learns from the lessons of Harvey? Often times, what we need is right in front of our face. In the case of Harvey, the case is no different. Having to drive throughout the city during the storm where virtually every business was closed something striking occurred to me. Office buildings that were over ten stories were ghost ships, while most shelters are assigned to schools and churches that are usually no more than two stories. The office building ghost ships,  that is to say that there was absolutely no one in them are an untapped asset in the city’s emergency infrastructure. As of 2015, Houston had 50 office buildings under construction totaling almost 18 million square feet of space. The locations of these buildings are widespread like Houston covering areas like downtown, the Energy Corridor/West Houston, the Woodlands (north), and others around the city creating a virtual net of buildings that if properly prepared with their owners could have been used at emergency shelters far above the flooding waters and much shorter distances to travel for Houstonians than what was comprised. The city’s major convention center, George R. Brown Center, was turned into the central hub of evacuation. Unfortunately, Houston’s geography is expansive. The city at its widest points can easily take almost two hours to get to the city center by car when traffic is not impaired. Couple that with low storied churches and schools and it is easy to see why office buildings which are more plentiful throughout the city could be a vital addition to emergency planning. What obstacles could be holding them back?

I suspect three main issues. One, the city’s planning department would need to ensure future buildings include potential emergency use in the developer’s plans. It would also require these buildings, their owners, and their tenants to be part of any emergency planning committee that would go into action should it be required. Almost the equivalent of a volunteer emergency force. Second, the additional cost that could be associated with fitting current and future buildings for such a task must be shouldered somehow. These costs that could certainly be offset by favorable tax credits for a period of time, municipal subsidizing, etc. The third issue would be security of sensitive information. I can not stress how vital this would be in considering which office buildings to consider given the sensitivity of identity theft both on a individual and institutional level. Again, all three of these things are logistical things that can be handled accordingly.

Every time we think we have seen the worst that Mother Nature has to throw at us, the ante seems to be upped just a little (or lot) more. We are continuing to change the dynamics by which we interact with our environment and in turn how the environment interacts with us. The burden of just how we handle future stresses that the natural disasters may pose will take a more broad minded and efficient strategy than what we currently use. Moving and evacuating large bodies of people will only get less and less likely in cities where density is increasing. One of the key to taking on a lot of weight is to spread out the weight so that it is properly balanced. The same goes for cities when it comes to disasters.


Unemployment Rate By HBCU State – June 2017

STATES WITH RISING UNEMPLOYMENT: 7

STATES WITH DECLINING UNEMPLOYMENT: 12

STATES WITH UNCHANGED UNEMPLOYMENT: 5

LOWEST: ARKANSAS – 3.4%

HIGHEST: DISTRICT OF COLUMBIA – 6.2%

STATE – UNEMPLOYMENT RATE (PREVIOUS)*

ALABAMA –  4.6% (4.9%)

ARKANSAS – 3.4% (3.4%)

CALIFORNIA – 4.7% (4.7%)

DELAWARE – 4.7% (4.7%)

DISTRICT OF COLUMBIA – 6.2% (6.0%)

FLORIDA – 4.1% (4.3%)

GEORGIA – 4.8% (4.9%)

ILLINOIS – 4.7% (4.6%)

KENTUCKY – 5.1% (5.0%)

LOUISIANA – 5.5% (5.7%)

MARYLAND – 4.1% (4.2%)

MASSACHUSETTS – 4.3% (4.2%)

MICHIGAN – 3.8% (4.2%)

MISSISSIPPI – 5.0% (4.9%)

MISSOURI –  3.8% (3.9%)

NEW YORK – 4.5% (4.4%)

NORTH CAROLINA – 4.2% (4.5%)

OHIO – 5.0% (4.9%)

OKLAHOMA – 4.3% (4.3%)

PENNSYLVANIA – 5.0% (5.0%)

SOUTH CAROLINA – 4.0% (4.1%)

TENNESSEE – 3.6% (4.0%)

TEXAS – 4.6% (4.8%)

VIRGINIA – 3.7% (3.8%)

*Previous month in parentheses.

African America’s July Jobs Report – 7.4%

Overall Unemployment: 4.3% (4.4%)

African America Unemployment: 7.4% (7.1%)

Latino America Unemployment: 5.1% (4.8%)

European America Unemployment: 3.8% (3.8%)

Asian America Unemployment: 3.8% (3.6%)

Previous month in parentheses.

Analysis: Overall unemployment dropped 10 basis points. This returns to matches a 16 year low. African and Latino both saw increases of 30 basis points in their unemployment rates, while Asian and European America’s change was negligible.

African American Male Unemployment: 7.0% (6.3%)

African American Female Unemployment: 6.5% (6.8%)

African American Teenage Unemployment: 23.3% (21.1%)

African American Male Participation: 68.0% (67.5%)

African American Female Participation: 62.5% (62.4%)

African American Teenage Participation: 30.4% (30.8%)

Analysis: African American Females remain a stagnant group in both unemployment and participation rate. African American Males saw quite a rise in their unemployment rate, but with a strong recovery in participation rate after two stagnant months. African American Teenagers saw a step back as their participation rate took a slight hit and unemployment rate rose over 200 basis points. For such a volatile group, this was on the light side.

African American Male-Female Job Gap: 989 000 jobs (945 000 jobs)

CONCLUSION: The overall economy added 209 000 jobs in July. This exceeded many economists expectations and marks 82 straight months of job growth. African America saw a job increase came in at 41 000, a fifth straight month of job gains. This was a significant pickup after a paltry June. The country maybe at full employment, but African America is far from it. It is questionable whether or not African America simply has the infrastructure to spur a massive job growth that would put it in line with the rest of the country. Participation rates for Males recovered, but the overall needle continues to be stagnant. African America’s participation rates trails European American by 40 basis points and Asian America by 170 basis points meaning significant economic stimulus is being lost on a monthly basis. A bigger issue is understanding the wage growth within the group. The BLS does not track earnings by race, but the overall sits at 2.5 percent so likely based on other African America economic trends, African America is bringing up the rear there as well compounding the problem.

African America currently needs 615 000 jobs to match America’s unemployment rate. A increase of 7 000 from June.

Unemployment Rate By HBCU State – May 2017

STATES WITH RISING UNEMPLOYMENT: 5

STATES WITH DECLINING UNEMPLOYMENT: 16

STATES WITH UNCHANGED UNEMPLOYMENT: 3

LOWEST: ARKANSAS – 3.4%

HIGHEST: DISTRICT OF COLUMBIA – 6.0%

STATE – UNEMPLOYMENT RATE (PREVIOUS)*

ALABAMA –  4.9% (5.4%)

ARKANSAS – 3.4% (3.5%)

CALIFORNIA – 4.7% (4.8%)

DELAWARE – 4.7% (4.6%)

DISTRICT OF COLUMBIA – 6.0% (5.9%)

FLORIDA – 4.3% (4.5%)

GEORGIA – 4.9% (5.0%)

ILLINOIS – 4.6% (4.7%)

KENTUCKY – 5.0% (5.1%)

LOUISIANA – 5.7% (5.8%)

MARYLAND – 4.2% (4.3%)

MASSACHUSETTS – 4.2% (3.9%)

MICHIGAN – 4.2% (4.7%)

MISSISSIPPI – 4.9% (5.0%)

MISSOURI –  3.9% (3.9%)

NEW YORK – 4.4% (4.3%)

NORTH CAROLINA – 4.5% (4.7%)

OHIO – 4.9% (5.0%)

OKLAHOMA – 4.3% (4.3%)

PENNSYLVANIA – 5.0% (4.9%)

SOUTH CAROLINA – 4.1% (4.3%)

TENNESSEE – 4.0% (4.7%)

TEXAS – 4.8% (5.0%)

VIRGINIA – 3.8% (3.8%)

*Previous month in parentheses.

African America’s June Jobs Report – 7.1%

Overall Unemployment: 4.4% (4.3%)

African America Unemployment: 7.1% (7.5%)

Latino America Unemployment: 4.8% (5.2%)

European America Unemployment: 3.8% (3.7%)

Asian America Unemployment: 3.6% (3.6%)

Previous month in parentheses.

Analysis: Overall unemployment rose 10 basis points. This was a rise from the lowest levels since May 2001. African and Latino America dropped 40 basis points, while Asian and European America were negligible in their change.

African American Male Unemployment: 6.3% (6.5%)

African American Female Unemployment: 6.8% (7.0%)

African American Teenage Unemployment: 21.1% (27.3%)

African American Male Participation: 67.5% (67.5%)

African American Female Participation: 62.4% (62.9%)

African American Teenage Participation: 30.8% (31.3%)

Analysis: All three African American groups saw decreases in their unemployment rate, but it was the Teenage group who led the way with an astounding 620 basis point drop. Participation rates though for women and teenagers both declining, while the men had no change.

African American Male-Female Job Gap: 945 000 jobs (1 038 000 jobs)

CONCLUSION: The overall economy added 222 000 jobs in June. This exceeded many economists expectations. African America saw a job increase came in at 16 000, a fourth straight month of job gains. However, job growth appears to be slowing after two months ago coming in at 100 000 and the month prior being at 46 000. Still this is the highest number of employed that African America has seen overall in sometime. Explaining job growth for the country let alone African America at this point has reached a guessing game for many economists. The participation rates continue to be a concern overall, especially among men who continue to see their number slide and women’s participation rate remains erratic at best.

African America currently needs 608 000 jobs to match America’s unemployment rate. A decrease of 108 000 from May.